
Architecture
To monitor the kubernetes cluster you will need two collectors. First if the agent collector which runs as a DaemonSet, one pod per node. It handles everything node-local: container logs, kubelet stats, host metrics, OTLP from local pods, and Kubernetes metadata enrichment. The gateway collector runs as a Deployment and handles everything cluster-wide: Kubernetes events, cluster-state metrics, and the only credentialed connection to your backend.
Why split it this way?
Four reasons, all rooted in how Kubernetes works.
- Container logs live on the node filesystem. Kubernetes writes every container's stdout/stderr to
/var/log/podson the node where the pod runs. Reading those files needs ahostPathmount, which is only safe on a DaemonSet. A single Deployment pod can't see other nodes' disks. - Kubelet stats are per-node. Each kubelet exposes a
/stats/summaryendpoint with metrics for the containers running on its own node. One scraper per kubelet, one kubelet per node. That's a DaemonSet. - Events and cluster-state metrics are cluster-wide. Kubernetes Events and
k8s_clustermetrics are scoped to the cluster, not the node. Running them on every agent would produce N copies of the same data. They belong on the gateway, where there's exactly one. - Backend credentials live in one place. Putting your backend's auth token in a Secret on every node multiplies the attack surface. The agent only needs to talk to the gateway over plain gRPC inside the cluster. Only the gateway holds the egress credential.
The agent (DaemonSet)
The agent has the bigger config of the two, because it does most of the enrichment. Four receivers, an extension or two, six processors in a specific order, and one exporter pointing at the gateway.
Receivers
otlp receives traces, metrics, and logs from local pods using the OTel SDK. Bind to the pod IP so each agent only accepts connections from pods on its own node:
receivers:
  otlp:
    protocols:
      grpc:
        endpoint: ${env:MY_POD_IP}:4317
      http:
endpoint: ${env:MY_POD_IP}:4318filelog tails container logs from the node filesystem. The container operator handles both Docker JSON and containerd CRI log formats automatically:
receivers:
  filelog:
    include: [/var/log/pods/*/*/*.log]
    include_file_path: true
    start_at: end
    storage: file_storage
    operators:
      - id: container-parser
        type: container
        max_log_size: 102400
    retry_on_failure:
enabled: trueA couple of things matter in production. start_at: end reads only new logs after startup, not the full backlog. And storage: file_storage checkpoints the read offset to disk so the agent picks up where it stopped after a restart. Skip the file storage and you'll either re-read from the top (duplicate logs) or skip ahead (lose them).
kubeletstats talks to the kubelet's /stats/summary endpoint and emits container, pod, and node metrics:
receivers:
  kubeletstats:
    auth_type: serviceAccount
    endpoint: ${env:K8S_NODE_NAME}:10250
    insecure_skip_verify: true
    collection_interval: 30s
metric_groups: [container, pod, node, volume]hostmetrics scrapes raw OS-level metrics from the node — CPU, memory, disk I/O, filesystem, load average, network, paging. Where kubeletstats answers "what's my workload doing," hostmetrics answers "what's the node doing." They overlap on CPU and memory but cover different angles, and only hostmetrics gives you load average, paging activity, and per-disk I/O.
receivers:
  hostmetrics:
    collection_interval: 30s
    root_path: /hostfs
    scrapers:
      cpu:
      memory:
      load:
      disk:
      network:
      paging:
      filesystem:
        exclude_mount_points:
          mount_points: [/var/lib/*, /dev/*, /proc/*, /sys/*, /run/*, /snap/*]
          match_type: regexp
        exclude_fs_types:
          fs_types: [autofs, binfmt_misc, cgroup2, configfs, debugfs, devpts, devtmpfs, fusectl, hugetlbfs, nsfs, overlay, proc, procfs, pstore, securityfs, selinuxfs, sysfs, tracefs]
match_type: strictroot_path: /hostfs tells the receiver to read /proc and /sys from a mounted host filesystem instead of the container's own. The hostPath mount that backs it gets added in the agent's OpenTelemetryCollector resource (covered in the deploy section below).
Using Grafana? The native kubeletstats and k8s_cluster receivers emit semconv-aligned metric names like k8s.container.cpu.usage and k8s.pod.phase. Grafana's pre-built Kubernetes Integration dashboards expect Prometheus-style names like container_cpu_usage_seconds_total and kube_pod_status_phase, so those dashboards won't light up with native receivers.
If you're shipping to Grafana and want the pre-built dashboards to work, use the prometheus receiver to scrape cAdvisor + the kubelet on the agent and kube-state-metrics on the gateway instead. For greenfield setups where you're building dashboards yourself, the native receivers are simpler.
Extensions
extensions:
  health_check:
    endpoint: ${env:MY_POD_IP}:13133
  file_storage:
directory: /var/lib/otelcolhealth_check exposes a liveness endpoint on port 13133. file_storage is what filelog uses for offset persistence.
Processors
The agent does most of the enrichment. Order matters:
memory_limiter → k8sattributes → resource/service-attrs →
resourcedetection → resource/hostname → batch
1. memory_limiter keeps the Collector from getting OOM-killed when a backend slows down. It watches process memory and pushes back on the receivers when usage gets close to the limit, which is why it has to be first.
processors:
  memory_limiter:
    check_interval: 1s
    limit_percentage: 85
spike_limit_percentage: 202. k8sattributes enriches every signal with Kubernetes resource attributes: namespace, the controller name (deployment / statefulset / daemonset / etc.), pod name, pod UID, container name, plus pod labels and pod annotations:
processors:
  k8sattributes:
    extract:
      otel_annotations: true
      metadata:
        - k8s.namespace.name
        - k8s.deployment.name
        - k8s.statefulset.name
        - k8s.daemonset.name
        - k8s.cronjob.name
        - k8s.job.name
        - k8s.replicaset.name
        - k8s.node.name
        - k8s.pod.name
        - k8s.pod.uid
        - k8s.pod.start_time
        - k8s.container.name
      labels:
        - from: pod
          key: app.kubernetes.io/version
          tag_name: app.kubernetes.io/version
        - from: pod
          key: app.kubernetes.io/name
          tag_name: app.kubernetes.io/name
        - from: pod
          key: app.kubernetes.io/instance
          tag_name: app.kubernetes.io/instance
    passthrough: false
    filter:
      node_from_env_var: K8S_NODE_NAME
    pod_association:
      - sources:
          - from: connection
      - sources:
          - from: resource_attribute
            name: k8s.pod.ip
      - sources:
          - from: resource_attribute
name: k8s.pod.uidotel_annotations: true is the one a lot of configs leave out. With it on, any pod annotation under the resource.opentelemetry.io/ prefix gets promoted to a resource attribute on every signal from that pod. This is the highest-priority source in the OTel Kubernetes attributes spec — app teams can set service.name, service.version, service.instance.id, deployment.environment.name, or any custom attribute straight from their Deployment manifest without touching SDK code:
metadata:
  annotations:
    resource.opentelemetry.io/service.name: checkout
    resource.opentelemetry.io/service.version: v1.4.2
resource.opentelemetry.io/deployment.environment.name: prodThe pod_association block matters more than it looks. Listing from: connection first means the processor uses the source IP of the inbound OTLP connection to find the pod. That only works if the agent is the first hop. Move k8sattributes to the gateway and the source IP becomes the agent's, not the original pod's, and pod lookups silently fail. This is the main reason k8sattributes belongs on the agent.
The node_from_env_var: K8S_NODE_NAME filter is the other one to set. Without it, every agent caches metadata for every pod in the cluster: N×N memory, N×N watch connections to the API server. With it, each agent watches only the pods on its own node.
3. resource/service-attrs picks up where annotations leave off. The OTel Kubernetes attributes spec defines a priority order for resolving service identity from Kubernetes metadata. For each attribute, the first source that exists wins:
service.name
resource.opentelemetry.io/service.nameannotationapp.kubernetes.io/instancelabelapp.kubernetes.io/namelabel- Controller name (deployment → statefulset → daemonset → cronjob → job)
- Pod name
- Container name
service.namespace
resource.opentelemetry.io/service.namespaceannotation- Pod's namespace (
k8s.namespace.name)
service.version
resource.opentelemetry.io/service.versionannotationapp.kubernetes.io/versionlabel- Container image tag
Step 1 in each chain the annotation is already handled upstream by k8sattributes with otel_annotations: true. This processor implements the rest. Every action is insert, which only writes the attribute if it isn't already set, so each step naturally falls back to the next:
processors:
  resource/service-attrs:
    attributes:
      # service.namespace fallback
      - key: service.namespace
        from_attribute: k8s.namespace.name
        action: insert

      # service.version fallback
      - key: service.version
        from_attribute: app.kubernetes.io/version
        action: insert

      # service.name fallback chain
      - key: service.name
        from_attribute: app.kubernetes.io/instance
        action: insert
      - key: service.name
        from_attribute: app.kubernetes.io/name
        action: insert
      - key: service.name
        from_attribute: k8s.deployment.name
        action: insert
      - key: service.name
        from_attribute: k8s.statefulset.name
        action: insert
      - key: service.name
        from_attribute: k8s.daemonset.name
        action: insert
      - key: service.name
        from_attribute: k8s.cronjob.name
        action: insert
      - key: service.name
        from_attribute: k8s.job.name
action: insertIf the app sets service.name in code (or via the SDK reading OTEL_SERVICE_NAME), that value is already on the signal when it hits this processor and every insert is a no-op. If it doesn't, the chain walks down until it finds the first source that exists. For most teams that's the deployment name, which is what you want.
4. resourcedetection auto-attaches resource attributes from the environment and the node:
processors:
  resourcedetection:
    detectors: [env, k8snode]
timeout: 2sAdd gcp / eks / aks detectors for cloud metadata as needed.
5. resource/hostname copies k8s.node.name into host.name. A lot of pre-built dashboards key off host.name for the node identifier, but k8sattributes only sets k8s.node.name. One line of config, one missing label fewer.
processors:
  resource/hostname:
    attributes:
      - key: host.name
        from_attribute: k8s.node.name
action: insert6. batch goes last. Without it, every span and log line becomes its own export call.
Exporter
exporters:
  otlp/gateway:
    endpoint: otel-gateway-collector.default.svc.cluster.local:4317
    tls:
insecure: truePlain gRPC inside the cluster, no TLS. The gateway is the credentialed boundary, not the agent.
Pipelines
Three pipelines sharing the same processor chain. metrics adds kubeletstats, logs adds filelog:
service:
  extensions: [health_check, file_storage]
  pipelines:
    logs:
      receivers: [otlp, filelog]
      processors: [memory_limiter, k8sattributes, resource/service-attrs, resourcedetection, resource/hostname, batch]
      exporters: [otlp/gateway]
    metrics:
      receivers: [otlp, kubeletstats, hostmetrics]
      processors: [memory_limiter, k8sattributes, resource/service-attrs, resourcedetection, resource/hostname, batch]
      exporters: [otlp/gateway]
    traces:
      receivers: [otlp]
      processors: [memory_limiter, k8sattributes, resource/service-attrs, resourcedetection, resource/hostname, batch]
      exporters: [otlp/gateway]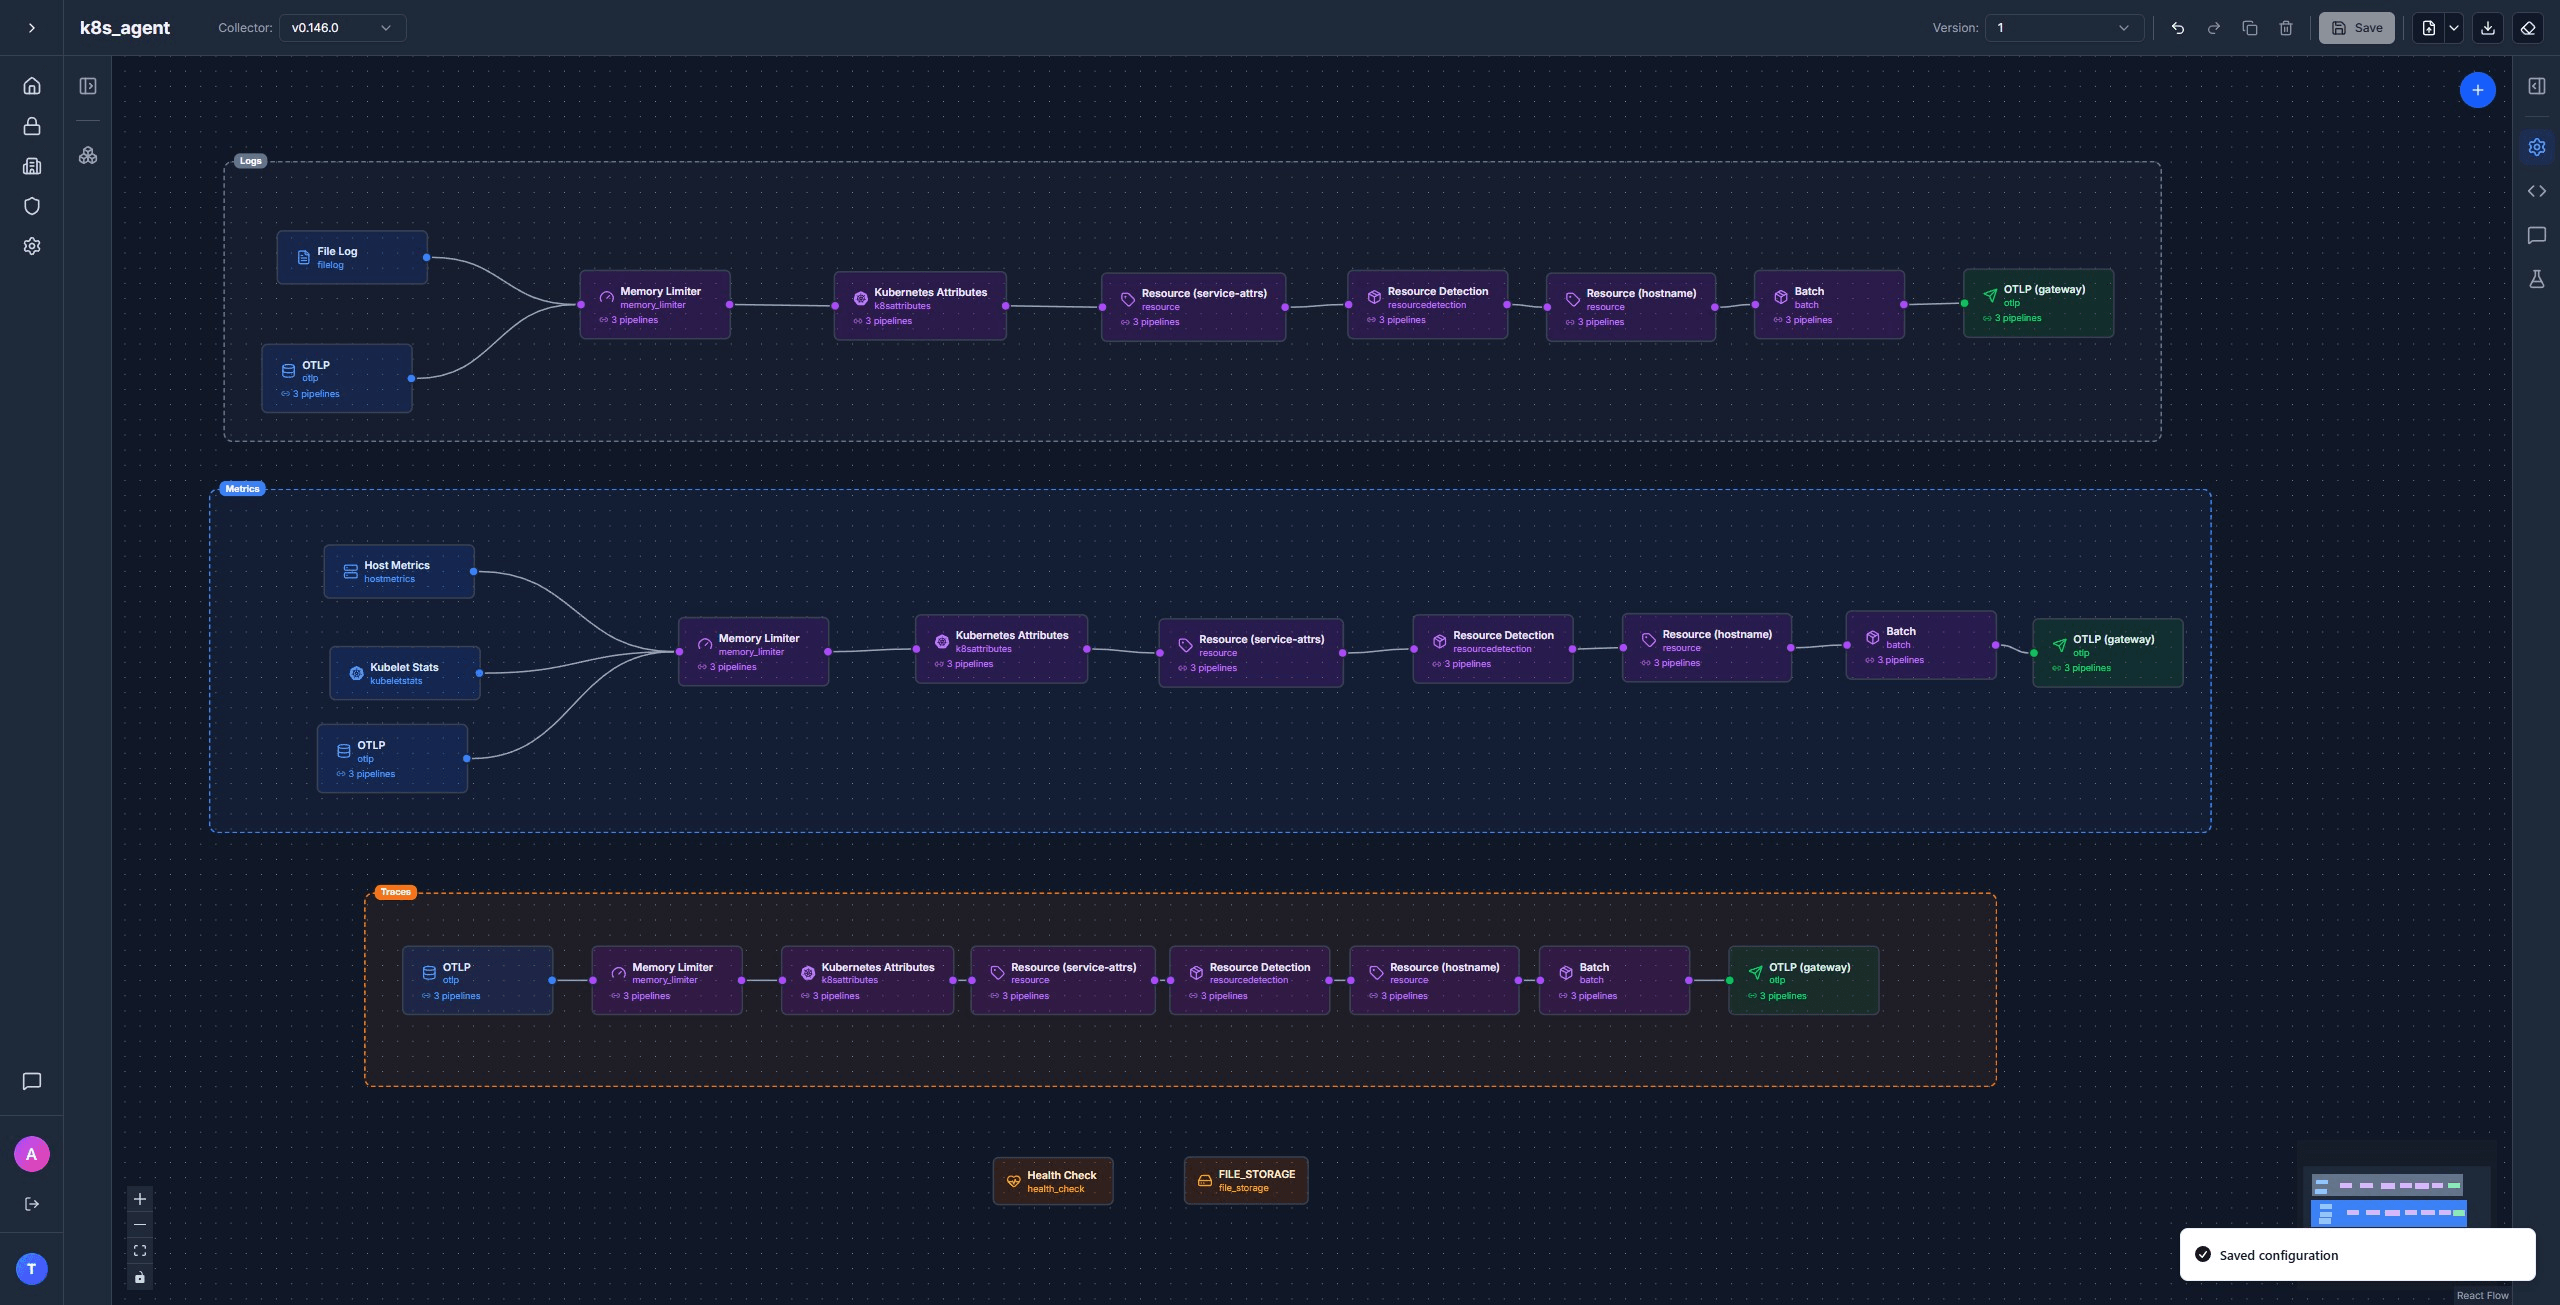
Get the full agent template in Telflo →
The gateway (Deployment)
Most of the heavy lifting is already done by the time data hits the gateway. The gateway adds the cluster-wide receivers and ships everything out to your backend.
Receivers
otlp receives from the agents:
receivers:
  otlp:
    protocols:
      grpc:
        endpoint: ${env:MY_POD_IP}:4317
      http:
endpoint: ${env:MY_POD_IP}:4318k8s_events reads Kubernetes Event objects from the API server and turns them into OTel log records. This is how OOMKills, image pull errors, scheduling failures, and the rest of the noisy stuff in kubectl get events end up in your logs backend without any extra glue:
receivers:
  k8s_events:
namespaces: []Empty namespaces means all namespaces. Events are cluster-wide, so this only runs on the gateway.
k8s_cluster watches the Kubernetes API for cluster-state metrics: deployment replica counts, pod phases, node conditions, container restart counts, PVC status, HPA scaling state. Same dataset that kube-state-metrics produces, but emitted natively as OTel metrics with no extra Deployment to install:
receivers:
  k8s_cluster:
    auth_type: serviceAccount
    collection_interval: 30s
    node_conditions_to_report: [Ready, MemoryPressure, DiskPressure, PIDPressure]
allocatable_types_to_report: [cpu, memory, ephemeral-storage]Processors
memory_limiter → resourcedetection → batch
1. memory_limiter and 2. resourcedetection behave the same as on the agent. 3. batch goes last.
Exporter
exporters:
  otlphttp/backend:
    endpoint: ${env:OTLP_ENDPOINT}
    headers:
Authorization: ${env:OTLP_AUTH_HEADER}Generic OTLP/HTTP. Keep the auth header in a Kubernetes Secret.
Pipelines
Four pipelines. The standard three plus a dedicated logs/k8s_events lane that adds an extra resource processor to label the events with a service name, so they group cleanly in your logs UI:
service:
  extensions: [health_check]
  pipelines:
    logs:
      receivers: [otlp]
      processors: [memory_limiter, resourcedetection, batch]
      exporters: [otlphttp/backend]
    logs/k8s_events:
      receivers: [k8s_events]
      processors: [memory_limiter, resourcedetection, resource/k8s_events, batch]
      exporters: [otlphttp/backend]
    metrics:
      receivers: [otlp, k8s_cluster]
      processors: [memory_limiter, resourcedetection, batch]
      exporters: [otlphttp/backend]
    traces:
      receivers: [otlp]
      processors: [memory_limiter, resourcedetection, batch]
      exporters: [otlphttp/backend]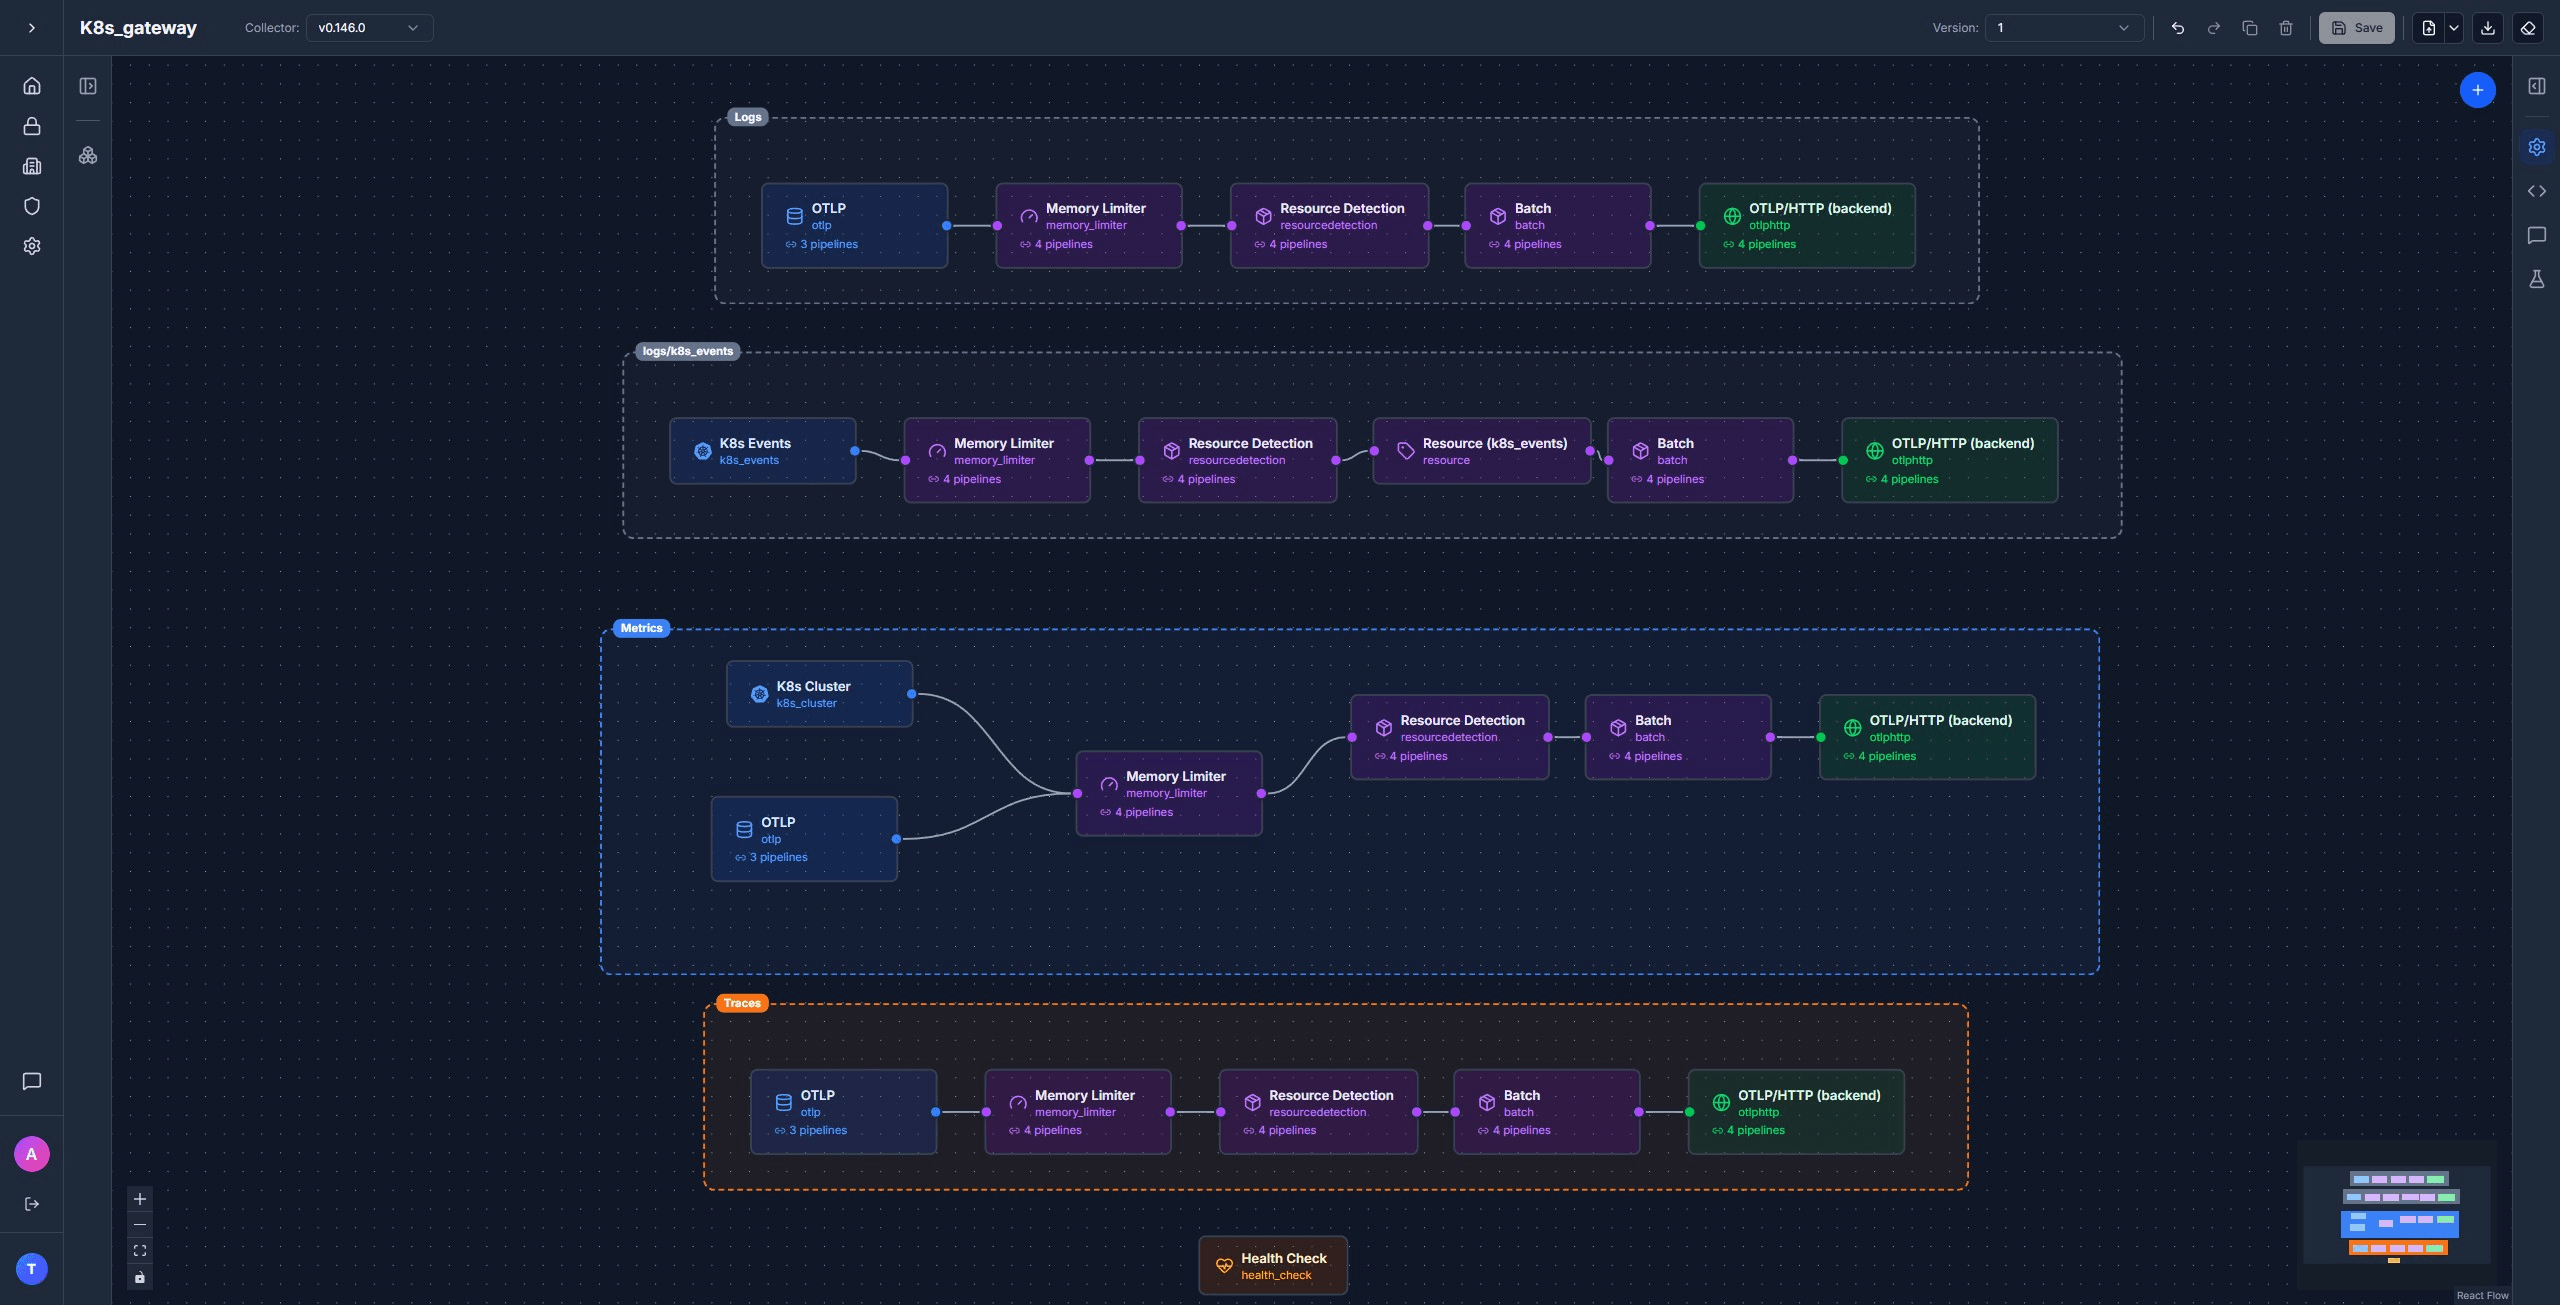
Get the full gateway template in Telflo →
Self-telemetry: don't loop the collector through itself
The Collector emits its own metrics and logs (queue depth, batch sizes, dropped data, internal errors). The obvious thing is to route those signals through the same pipeline that handles your application telemetry. Don't.
If the pipeline is unhealthy, memory_limiter is throttling, batch is backed up, the export queue is full, then the Collector's own health metrics get caught in the same backpressure they're supposed to report on. You lose visibility into the Collector right when you need it most. Bypass the pipeline:
service:
  telemetry:
    metrics:
      level: basic
      readers:
        - periodic:
            exporter:
              otlp:
                protocol: http/protobuf
                endpoint: ${env:OTLP_ENDPOINT}/v1/metrics
                headers:
                  - name: authorization
                    value: ${env:OTLP_AUTH_HEADER}
    logs:
      processors:
        - batch:
            exporter:
              otlp:
                protocol: http/protobuf
                endpoint: ${env:OTLP_ENDPOINT}/v1/logs
                headers:
                  - name: authorization
value: ${env:OTLP_AUTH_HEADER}Apply the same block to both the agent and the gateway.
Deploying
The configs above sit inside an OpenTelemetryCollector custom resource. Each one needs RBAC so the collector's ServiceAccount can read what it needs from the API, and the agent needs hostPath volume mounts so filelog can read container logs and file_storage can checkpoint offsets.
Prerequisite: the OpenTelemetry Operator
The OpenTelemetryCollector custom resource is created and managed by the OpenTelemetry Operator. Install it once per cluster:
kubectl apply -f https://github.com/open-telemetry/opentelemetry-operator/releases/latest/download/opentelemetry-operator.yamlAgent: RBAC
The agent calls the Kubernetes API for pod lookups (k8sattributes) and the kubelet for stats. ClusterRole + ClusterRoleBinding bound to the otel-agent-collector ServiceAccount:
apiVersion: rbac.authorization.k8s.io/v1
kind: ClusterRole
metadata:
  name: otel-agent-collector
rules:
  - apiGroups: [""]
    resources: [nodes, nodes/stats, nodes/proxy, nodes/metrics, pods, namespaces, endpoints]
    verbs: [get, list, watch]
  - apiGroups: [apps]
    resources: [replicasets, daemonsets, deployments, statefulsets]
    verbs: [get, list, watch]
  - apiGroups: [batch]
    resources: [jobs, cronjobs]
    verbs: [get, list, watch]
---
apiVersion: rbac.authorization.k8s.io/v1
kind: ClusterRoleBinding
metadata:
  name: otel-agent-collector
subjects:
  - kind: ServiceAccount
    name: otel-agent-collector
    namespace: default
roleRef:
  kind: ClusterRole
  name: otel-agent-collector
apiGroup: rbac.authorization.k8s.ioAgent: the OpenTelemetryCollector resource
Wraps the config: block from earlier. The non-config parts that matter: mode: daemonset, the downward-API env vars that the receivers reference, the varlogpods hostPath mount, and an emptyDir for file_storage to checkpoint to:
apiVersion: opentelemetry.io/v1beta1
kind: OpenTelemetryCollector
metadata:
  name: otel-agent
  namespace: default
spec:
  mode: daemonset
  serviceAccount: otel-agent-collector
  env:
    - name: MY_POD_IP
      valueFrom:
        fieldRef:
          fieldPath: status.podIP
    - name: K8S_NODE_NAME
      valueFrom:
        fieldRef:
          fieldPath: spec.nodeName
  volumes:
    - name: varlogpods
      hostPath:
        path: /var/log/pods
    - name: otelcol-storage
      emptyDir: {}
    - name: hostfs
      hostPath:
        path: /
  volumeMounts:
    - name: varlogpods
      mountPath: /var/log/pods
      readOnly: true
    - name: otelcol-storage
      mountPath: /var/lib/otelcol
    - name: hostfs
      mountPath: /hostfs
      readOnly: true
      mountPropagation: HostToContainer
  config:
# ... receivers, extensions, processors, exporters, service from earlier ...Gateway: RBAC
The gateway needs API access for k8s_events and k8s_cluster:
apiVersion: rbac.authorization.k8s.io/v1
kind: ClusterRole
metadata:
  name: otel-gateway-collector
rules:
  - apiGroups: [""]
    resources: [nodes, nodes/proxy, services, endpoints, pods, events]
    verbs: [get, list, watch]
  - apiGroups: [apps]
    resources: [deployments, replicasets, statefulsets, daemonsets]
    verbs: [get, list, watch]
---
apiVersion: rbac.authorization.k8s.io/v1
kind: ClusterRoleBinding
metadata:
  name: otel-gateway-collector
subjects:
  - kind: ServiceAccount
    name: otel-gateway-collector
    namespace: default
roleRef:
  kind: ClusterRole
  name: otel-gateway-collector
apiGroup: rbac.authorization.k8s.ioGateway: the Secret and the OpenTelemetryCollector resource
The backend's auth header lives in a Secret, mounted into the gateway via envFrom:
kubectl create secret generic otlp-credentials \
  -n default \
  --from-literal=OTLP_ENDPOINT="https://otlp.example.com" \
--from-literal=OTLP_AUTH_HEADER="<your-token>"apiVersion: opentelemetry.io/v1beta1
kind: OpenTelemetryCollector
metadata:
name: otel-gateway
namespace: default
spec:
mode: deployment
replicas: 1
serviceAccount: otel-gateway-collector
envFrom:
- secretRef:
name: otlp-credentials
env:
- name: MY_POD_IP
valueFrom:
fieldRef:
fieldPath: status.podIP
config:
# ... receivers, extensions, processors, exporters, service from earlier ...Apply
kubectl apply -f otel-agent-cr.yaml
kubectl apply -f otel-gateway-cr.yamlVerify the agent is on every node:
kubectl get pods -n default -l app.kubernetes.io/name=otel-agent-collector -o wideAnd the gateway is up:
kubectl get pods -n default -l app.kubernetes.io/name=otel-gateway-collectorVerifying end-to-end
Check agent logs for successful exports to the gateway, and gateway logs for successful exports to your backend:
kubectl logs -n default -l app.kubernetes.io/name=otel-agent-collector --tail=50
kubectl logs -n default -l app.kubernetes.io/name=otel-gateway-collector --tail=50Look for StatusCode: 200 and no Failed to export errors. In your backend, you should see:
- Container stdout/stderr from every pod, with
k8s.namespace.name,k8s.pod.name,k8s.container.name, andservice.nameattached. - Container, pod, and node metrics from
kubeletstats; OS-level system metrics fromhostmetrics(load average, paging, per-disk I/O); and cluster-state metrics fromk8s_cluster. - Spans with
k8s.*resource attributes attached. - A
logs/k8s_eventsstream with pod scheduling, image pulls, OOMKills.

