OpenTelemetry without the chaos
Cut observability costs, test every change before it ships, route telemetry anywhere, and manage your whole fleet with Telflo.
AI first
The fleet management tool for AI agents
Agents build, test, and deploy collector configurations from the console you already work in.
> New cluster eu-central is up, shop services in namespace shop. Get it collecting into the gateway prod-eu-west uses, otlp-gateway.internal:4317.
Starting from the Kubernetes flow. The edits are the cluster name and the namespace scope.
$ telflo flows list: 11 flows · kubernetes-telemetry-stack (metrics, logs) · otelcol-contrib 0.147.0
$ telflo flows pull kubernetes-telemetry-stack -o flow.yaml: wrote flow.yaml · pinned to otelcol-contrib 0.147.0
flow.yaml: 4 pipelines, 2 roles, 2 env vars, no cluster name. Split: node.yaml (logs/pods, metrics/node), cluster.yaml (metrics/cluster, logs/events).
Needs, In the flow, Target, Action. OTLP_ENDPOINT, ${env:OTLP_ENDPOINT}, otlp-gateway.internal:4317, --env at install. Cluster name, not set, eu-central, add k8s.cluster.name. Namespace scope, all namespaces, shop, filter logs/pods to shop. Collector roles, DaemonSet + singleton, one file, one config per role, split node.yaml, cluster.yaml
$ telflo config create --name "eu-central k8s-node-agent" -f node.yaml: created · eu-central k8s-node-agent b4e27d19 · draft v1
$ telflo config create --name "eu-central k8s-cluster" -f cluster.yaml: created · eu-central k8s-cluster d07c3a52 · draft v1
Two edits on node.yaml: k8s.cluster.name in k8s_attributes, filter/shop on logs/pods. Node metrics have no namespace, so no filter there.
node.yaml · processors: k8s_attributes: extract: metadata: - k8s.node.name +- k8s.cluster.name +filter/shop: +logs: +log_record: +- resource.attributes["k8s.namespace.name"] != "shop" logs/pods: -processors: [memory_limiter, k8s_attributes, resourcedetection, batch] +processors: [memory_limiter, k8s_attributes, filter/shop, resourcedetection, batch]
$ telflo ottl lint node.yaml: 1 of 1 expressions parse · 390 ms
$ telflo validate node.yaml --config b4e27d19: invalid · processors::k8s_attributes: "k8s.cluster.name" is not a supported metadata field · exit 4
The API server has no cluster name for k8s_attributes to extract. A resource processor sets it in all four pipelines; logs/pods shown.
node.yaml · resource/cluster: processors: +resource/cluster: +attributes: +- key: k8s.cluster.name +value: eu-central +action: upsert - k8s.node.name -- k8s.cluster.name logs/pods: -processors: [memory_limiter, k8s_attributes, filter/shop, resourcedetection, batch] +processors: [memory_limiter, k8s_attributes, filter/shop, resource/cluster, resourcedetection, batch]
$ telflo validate node.yaml --config b4e27d19: valid · otelcol-contrib 0.147.0 · 2.3 s
$ telflo validate cluster.yaml --config d07c3a52: valid · otelcol-contrib 0.147.0 · 1.9 s
$ telflo config push b4e27d19 -f node.yaml --publish: patched v1 · published
$ telflo config push d07c3a52 -f cluster.yaml --publish: patched v1 · published
$ telflo fleet create --label eu-central --type kubernetes-supervisor: created · fleet eu-central 3c8f41a7 · connection token 9a1d6e2b
$ telflo deploy --fleet 3c8f41a7 --config b4e27d19 --name k8s-node-agent --role node: created · deployment 5e92c0d4 serves v1
$ telflo deploy --fleet 3c8f41a7 --config d07c3a52 --name k8s-cluster --role cluster: created · deployment a71b3f06 serves v1
$ telflo fleet install 3c8f41a7 --platform kubernetes --deployment 5e92c0d4 --env OTLP_ENDPOINT=otlp-gateway.internal:4317 > install-node.sh: wrote install-node.sh · values URL expires in 24 h
Same command with --deployment a71b3f06 into install-cluster.sh. Both files carry the fleet token, so they stay out of this chat.
Run install-node.sh, then install-cluster.sh, with cluster-admin on eu-central.
Both install into namespace telflo-collectors, so the shop filter drops the collectors' own logs too.
> Ran both. Did the collectors come up?
Read fleet eu-central in Telflo: 13 collectors connected across both deployments, v1 applied on all 13, last heartbeat 16:07.
eu-central · k8s-node-agent · v1: 12 of 12. 12 of 12 nodes connected, v1 applied
Read the last 5 min via Grafana MCP: 6 shop services, 12 nodes, 0 logs from other namespaces, all tagged k8s.cluster.name=eu-central.
Both configs are published at v1. The next change is a push, which becomes v2, then a deploy, with v1 kept to revert to.
eu-central is up on v1. Shop container logs, Kubernetes events and node and cluster metrics are reaching otlp-gateway.internal:4317.
Interfaces
MCP server
From Claude Code, Cursor, or any MCP client, under the same scoped tokens as the CLI.
CLI
The same loop, run as commands from terminals, scripts, and CI.
Use cases
Take control of your telemetry pipeline
Cut the bill, ship changes without breaking prod, and keep regulated data where it belongs. Here is what teams use Telflo for.
Architecture
Your collectors, your data. Telflo's control plane.
Your telemetry flows the same way it always has, from your services through your collectors to your backends. Telflo just gives you an easy way to run the configuration that produces it.
Telflo doesn't have a backend of its own. Your collectors export straight to whichever backends you pick, and you can route to several at once or switch any time.
Lifecycle
How it works
Write a config, validate it, test it against sample data, and roll it out to your fleet. Here is each step as it looks in Telflo.
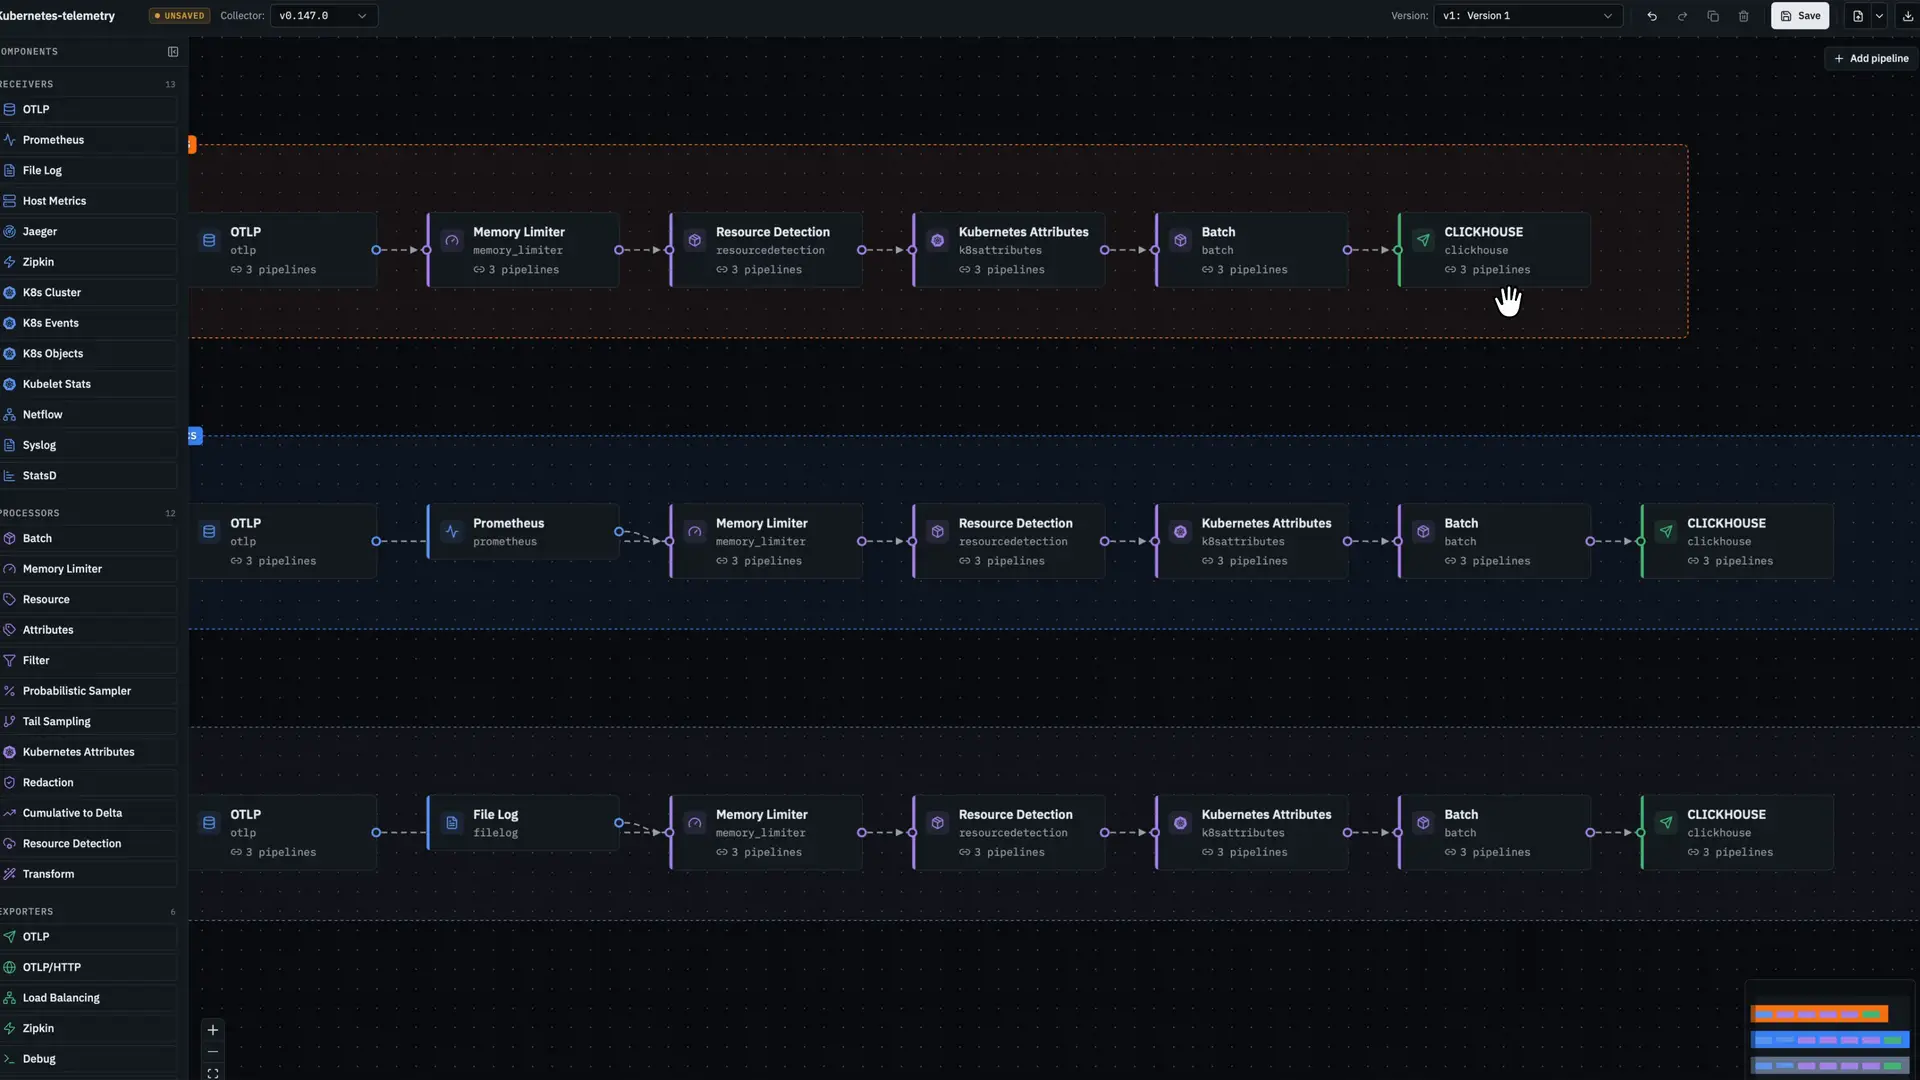
Build
Build or import your collector configs.
Drag receivers, processors, and exporters onto the canvas, or bring in a config you already run. Paste the YAML, or point an existing collector at Telflo to import what it reports.
Visualize
See the whole pipeline at a glance.
Receivers, processors, exporters in three colors. Trace any signal from source to backend without scrolling YAML.
Validate
Catch errors before they ship.
It validates against the real OTel schema and type-checks every reference. Broken configs never leave the editor.
Test
Unit tests, but for telemetry pipelines.
Write rules for your processors, then run a change against sample or uploaded telemetry on the real collector. The rules assert on the output, so broken transformations never reach production.
Deploy
One push to every collector.
Remote fleet management. No SSH loops, no config drift, no manual restarts. Stage a version on a few collectors, promote it fleet-wide, and roll back instantly when something breaks.
Govern
ComingGolden paths for telemetry config.
Platform teams decide which processors, exporters, and policies are allowed. App teams build pipelines from those pre-vetted components, and OPA enforces the rules so nothing ships out of compliance.
Flows
Start from a pipeline that already works
Prebuilt collector configurations, each solving one problem. Researched against the component docs, validated with the real collector binary, and ready to open in the editor.
For observability backends
If your platform ingests OpenTelemetry data, Telflo helps your customers build, test, and roll out the collector pipelines that route their data to you.
Get started
Ready to run a real control plane?
Start building your first OpenTelemetry pipeline in the editor. No install, no credit card. Bring the collector config you already run.