
We build Telflo, a control plane for OpenTelemetry collectors. People use it to build and test collector configs, then push them to their fleets over OpAMP. So it was a little embarrassing that until this summer, our observability was the CloudWatch console open in five browser tabs.
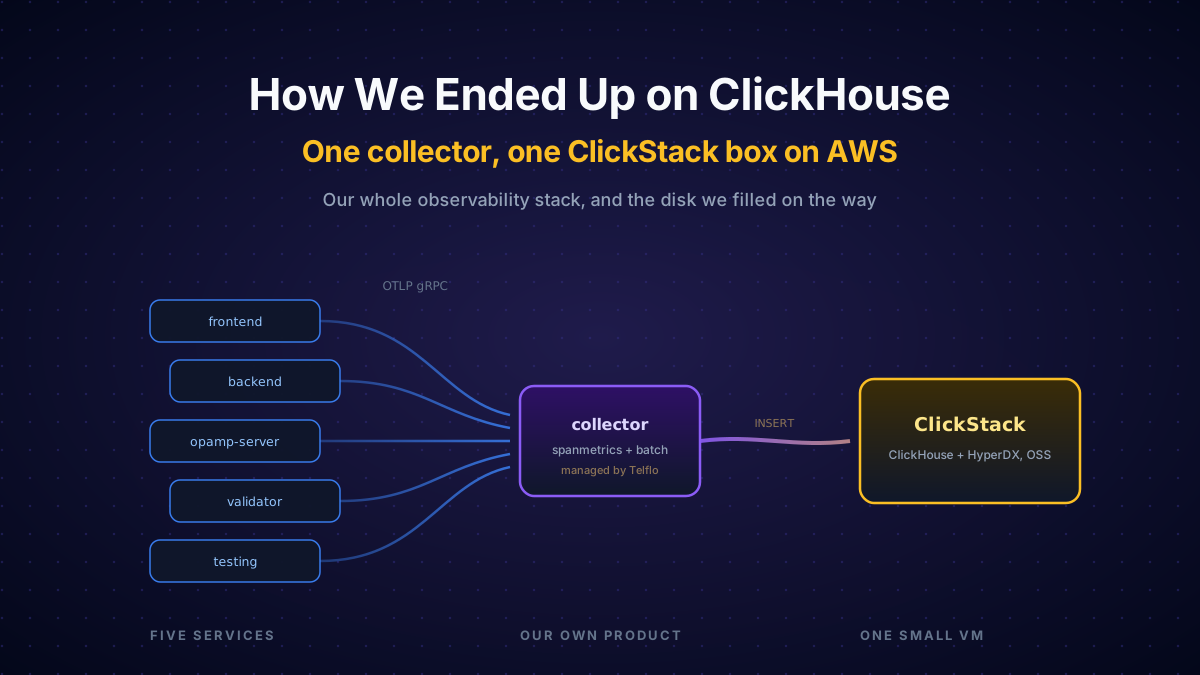
We fixed that. Five services now ship traces, logs, and runtime metrics through one collector into ClickStack, ClickHouse's open source observability stack, running on a single EC2 instance. About $135 a month, all in.
Every published story about ClickHouse and telemetry is petabyte-scale. LogHouse, ClickHouse's internal logging platform, was at 431 PiB and 1.59 quadrillion rows in June. The top Hacker News comment on the original LogHouse post asked for benchmarks in the terabyte range instead. We're closer to that end: one collector, one box, a few hundred gigabytes a month. This is how we set it up and what we got wrong.
What we run, August 2026: ClickStack OSS via Docker Compose (ClickHouse, the HyperDX UI, their gateway collector, and MongoDB) on one EC2 m7g.xlarge, 4 vCPU / 16 GiB / 200 GB gp3, about $135/month. One otelcol-contrib v0.147.0 gateway of our own in front, managed over OpAMP. Retention bumped from ClickStack's 3-day default to 14 days for logs, 30 for traces. A few hundred million rows a month. No sampling, no Kafka, no replicas.
The box that filled its disk
Our production is five services on AWS, and the traffic mostly comes from one of them: a couple hundred collector fleets check in with our OpAMP server every thirty seconds. CloudWatch is fine for "did the deploy start." It can't follow a request across services, and it can't answer "which org hit the validation timeout this week."
We also had a warning shot. Our public demo ships its telemetry into one of those all-in-one LGTM containers (Prometheus, Loki, Tempo, and Grafana OSS in one image). In July that box died: the image keeps its data in the container's writable layer, nothing caps retention, and six weeks of demo telemetry filled the 45 GB disk. Grafana kept loading and silently stopped showing new data, and then the OOM killer started on the neighboring containers. That one was on us, it's a demo image. But since then we assume anything that stores telemetry will eventually fill the disk unless we cap it ourselves.
Why ClickHouse
What we needed: traces first, because our stack is Python, Node, and Go and the questions we can't answer are cross-service ones. Logs correlated to those traces, queryable in SQL, which everyone here already knows. One system on one box with a known monthly cost, because we're a small team and don't want to run more systems than we have to.
There's also the obvious reason. A lot of the teams we work with run this exact pipeline, collectors shipping OTLP into ClickHouse, and we spend our days debugging it with them. We should be running it ourselves.
We did look around first. Most of what we found was either not meant for production or was already ClickHouse underneath:
- Run LGTM properly. That's Loki, Tempo, and Mimir, three separately scaled backends that each want object storage, plus Grafana in front. A lot to be on call for.
- SigNoz. A strong product, but self-hosting it means running ClickHouse plus Keeper plus Postgres plus the SigNoz app plus their collector. We'd be operating ClickHouse either way, just with four extra services around it.
- Uptrace, OpenObserve, the Victoria stack. All reasonable. Uptrace wants ClickHouse, Postgres, and Redis; OpenObserve's tracing is newer than its logging; VictoriaMetrics is great but three signals means three Victoria databases.
- Just use Postgres. We already run it via Supabase. The problem is the workload: telemetry is append-only wide events, and the queries are almost all aggregations over time ranges. Uber measured over 80% of their log queries were aggregations, and Langfuse started on Postgres, hit the wall, and rebuilt on ClickHouse. At our volume Postgres would survive a year. We'd just be signing up for that migration later.
So we went with ClickStack: ClickHouse, the HyperDX UI, and a gateway collector, packaged together, one Docker Compose on one box. We wrote up the general case for ClickHouse as a telemetry backend separately; this is the small version.
How it's wired
Most of the decisions in that picture are on the instrumentation side.
We turned off a lot of the SDK defaults. Everything is a no-op unless OTEL_EXPORTER_OTLP_ENDPOINT is set, so local dev and CI never load an exporter. Health checks are excluded from tracing, because probes hit every service every 10 to 30 seconds and were a noticeable slice of span volume. The OpAMP heartbeats went the other way: they're our biggest single source of spans and we kept them, because "show me every check-in from this agent over the last hour" is the query we run most when someone tells us their collector is acting weird.
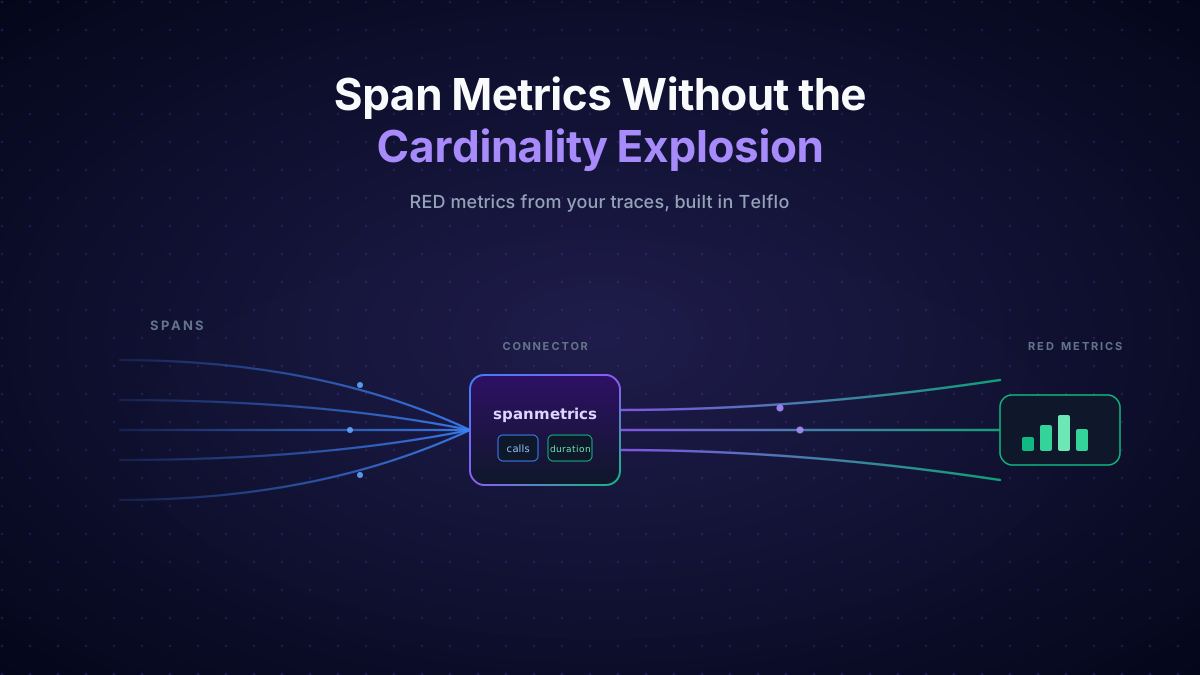
Request rates, error rates, and latency histograms come from our gateway's spanmetrics connector, so the SDKs drop their HTTP metrics and only export runtime metrics. If you keep both, you store the same numbers twice and the two copies drift apart.
There was also a feedback loop to break. The OTel SDK logs its export failures, and if those log lines get exported, an outage of the backend generates telemetry about the outage, which fails to export, which generates more. The SDK's logger is pinned to WARNING and kept out of the export path.
There's no sampling anywhere. We keep every span, heartbeats included. User content stays out of telemetry by policy.
One detail we like: ClickStack's bundled collector is itself managed over OpAMP, by HyperDX, which pushes its config and the auto-generated ingestion key. So there are two collectors in this diagram, and both are managed remotely over the same protocol. Ours is enrolled in Telflo, theirs is managed by HyperDX.
The collector question
ClickStack OSS ships with its own gateway collector, and it's the best part of the onboarding: you write no collector config at all. HyperDX generates an ingestion key, pushes the pipeline to the bundled collector over OpAMP, and anything that can speak OTLP can send to it. Our gateway stays thin because their gateway does the ClickHouse-specific work:
receivers:
  otlp:
    protocols:
      grpc:
        endpoint: 0.0.0.0:4317

processors:
  memory_limiter:
    check_interval: 1s        # default is 0, which means OFF. set it.
    limit_mib: 800
    spike_limit_mib: 200
  batch:
    timeout: 5s
    send_batch_size: 8192

connectors:
  spanmetrics:
    dimensions:
      - name: http.request.method
      - name: http.route       # bounded. never http.url.
    aggregation_cardinality_limit: 1000

exporters:
  otlphttp/clickstack:
    endpoint: https://<clickstack-box>:4318
    headers:
      authorization: ${env:CLICKSTACK_INGESTION_KEY}   # bare key, no Bearer
    compression: gzip

service:
  pipelines:
    traces:
      receivers: [otlp]
      processors: [memory_limiter, batch]
      exporters: [spanmetrics, otlphttp/clickstack]
# metrics and logs pipelines look the same, minus spanmetricsThen the same question started coming up in conversations with teams running Managed ClickStack on ClickHouse Cloud, and we learned the catch: on the managed path, ingestion is entirely left to you. There's no bundled gateway. The docs recommend running the ClickStack distribution of the collector yourself, pointed at your Cloud instance with database credentials, and it's a custom OCB build whose config is merge-only: you can add components through a custom config file, but you can't override the base ones.
That's fine for a fresh start. It's awkward if you already run a collector fleet, and most teams we talk to already do. They don't want to run a second collector distribution with its own way of doing things; they want their existing contrib gateway to do what the ClickStack distro does. The docs allow for exactly this ("if you choose to bring your own, ensure it includes the ClickHouse exporter"), but the details are spread across four pages: the exporter settings, the batching, parsing JSON log bodies into attributes so they're queryable, and writing the tables in a schema the HyperDX UI can auto-detect.
So we packaged that config as a Flow. Flows are pre-built pipelines in Telflo, built from setups we run ourselves or have helped other teams debug. This one is for teams on ClickHouse Cloud who want to keep their own collectors: contrib distribution, ClickHouse exporter, the processing their distro would have done, testable against your own data before it ships. Flows are rolling out in the platform now.
Reading it
The HyperDX UI does log search, trace waterfalls, and charting, and it auto-attaches to the OTel tables. We reach it over an SSH tunnel, because nothing on the box faces the internet except the OTLP port. For anything the UI makes awkward, we use clickhouse-client and plain SQL: which orgs hit validator timeouts this week, p95 by route by day, one user's whole trace history.
Two things we changed on day one. ClickStack retains data for three days by default, and their production docs say that default "often needs to be modified"; ours is 14 days for logs and 30 for traces. And the session secret ships as a placeholder you're supposed to replace, which we did.
Alerting
The scenario we planned around: ClickHouse is down, and we don't know, because the thing that would tell us is ClickHouse. The Prometheus crowd worked through this years ago with meta-monitoring and dead man's switches, and the small-company version turns out to be a cron and an email.
HyperDX handles the in-band alerts: search alerts on error spikes per service, delivered to Slack through an incoming webhook, since OSS notification channels are webhooks. The out-of-band layer is a cron on the box that runs three clickhouse-client checks (is telemetry fresh, is the error rate sane, is the disk under 80%) and pings a healthchecks.io URL only when all three pass. If a check throws, or the cron dies, or ClickHouse dies, or the whole instance dies, the ping stops arriving and we get emailed. CloudWatch's stock EC2 alarms sit underneath all of that.
When ClickHouse does go away, our gateway rides it out: failed sends retry with backoff while new batches queue a thousand deep, which at our flush cadence covers around an hour before anything drops.
There's one loop we can't close. Our collector reports its health over OpAMP to our OpAMP server, and the OpAMP server is one of the five services the collector carries telemetry for. So the thing that actually watches the watcher here is the cron and CloudWatch.
What still sucks
- MongoDB. HyperDX keeps dashboards and alerts in Mongo, so the box runs a fourth database engine for a few megabytes of app state. Moving that metadata into ClickHouse was proposed and closed as not planned.
- OSS alert channels are webhooks only, no email, and there's no muting or deduplication. Fine for us, but thin if you have a real on-call rotation.
- One team per OSS install, no roles. Fine at our size.
- Fourteen days of traces tells you what broke this week, but not whether the app is slower than it was in March. A downsampled long-retention metrics table is the first thing we plan to add.
The dogfooding part
The gateway in this post is enrolled in Telflo. Its config was built in our editor, validated, run against recorded traffic in the sandbox, and pushed over OpAMP, the same steps anyone using Telflo goes through. We won't oversell what that proves; it's one collector, and real fleets are bigger. But the scariest thing in this whole setup is pushing a config change to the collector that carries all our telemetry, and that push goes through validation and a behavioral test first, with one click back if we get it wrong. Fat-fingered collector YAML is the problem the product exists for, so we'd rather hit the rough edges ourselves.
If you're running something like this at small scale, we'd like to hear how it went, especially the parts that broke. If you're on ClickHouse Cloud and want your existing collectors doing the work, the Flow is where we put everything this post skipped.
Manage your OpenTelemetry collectors with Telflo today.
Design, test, and deploy OpenTelemetry Collectors in one platform.
Sign up now