
Supabase gives you two options into your project's telemetry. The Metrics API is a Prometheus endpoint covering Postgres, the underlying host, and the rest of the stack. Log drains push every log line from Postgres, Auth, Storage, Edge Functions, Realtime, and the API gateway to a destination you choose, and one of those destinations is plain OTLP.
Both speak open protocols, so you don't need a vendor integration for either. One OpenTelemetry Collector can pull the metrics, receive the logs, label both with the same project, and ship them to whatever OTLP backend you run.
Architecture
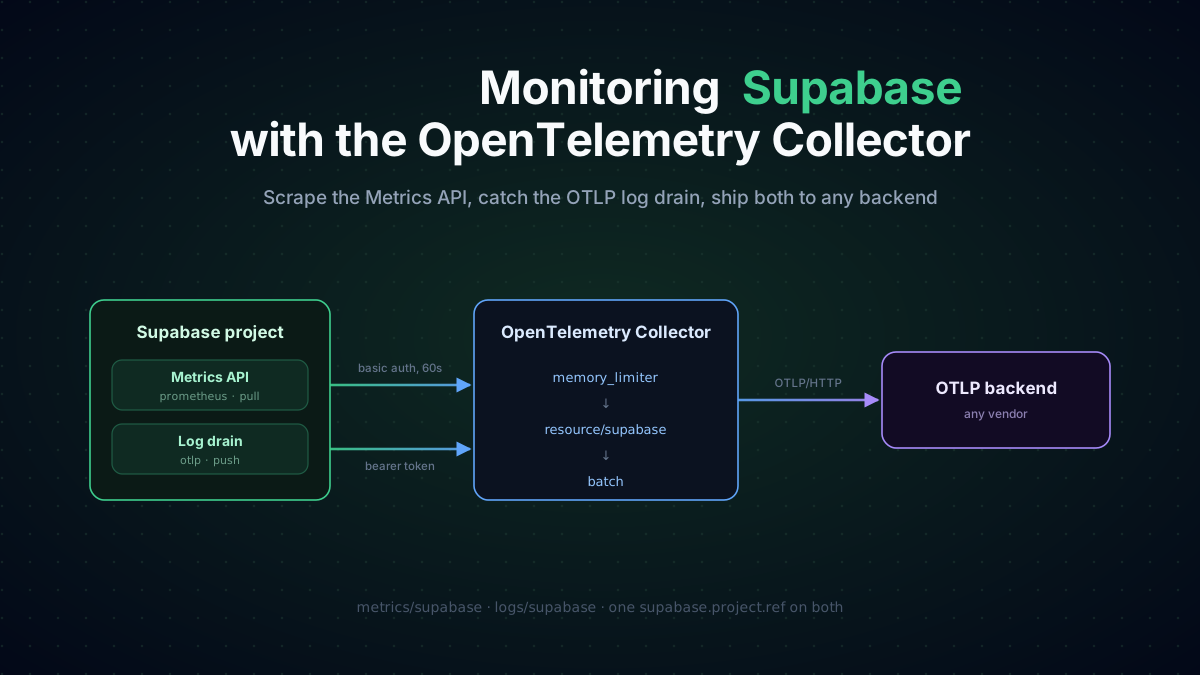
The two Supabase sources reach the collector in opposite directions. The collector pulls the Metrics API once a minute with a secret key. Supabase pushes logs to the collector through the OTLP log drain, authenticated with a bearer token. Both then go through the same processors and out a single OTLP/HTTP exporter to your backend.
Why put a collector in the middle?
You could point the log drain straight at your backend and have the backend scrape the Metrics API. Four reasons not to.
- The two signals arrive in opposite directions. Metrics are pulled: something has to call the Metrics API once a minute with your secret key. Logs are pushed: Supabase calls you. A collector handles both in one process, so you aren't splitting the job between a backend scraper and a drain config.
- You want one label on both. The value of having metrics and logs side by side is joining them on the project. The collector stamps the same
supabase.project.refon every metric and every log record, no matter what each source sends. - Switching backends is easy. Supabase only knows the collector's URL, so you change the backend in one place.
- Credentials live in one place. The Supabase secret key and your backend's auth token both sit on the collector. Supabase gets a single drain token that only lets it write logs to one endpoint.
Receivers
Metrics: prometheus/supabase
The Metrics API is a Prometheus text endpoint behind HTTP Basic Auth, so the prometheus receiver scrapes it with a standard scrape config:
receivers:
  prometheus/supabase:
    config:
      scrape_configs:
        - job_name: supabase
          scrape_interval: 60s
          scrape_timeout: 30s
          scheme: https
          metrics_path: /customer/v1/privileged/metrics
          basic_auth:
            username: service_role
            password: ${env:SUPABASE_SECRET_KEY}
          static_configs:
            - targets:
                - ${env:SUPABASE_HOST}:443
              labels:
supabase_project: ${env:SUPABASE_PROJECT_REF}A few things matter here. scrape_interval: 60s matches what Supabase recommends; the endpoint refreshes once a minute, so scraping faster just repeats the same values. scrape_timeout: 30s gives the endpoint room on larger projects, where the response is larger.
The password is a secret API key (the sb_secret_... kind) from Project Settings → API Keys. Create a dedicated one for metrics so you can rotate it without touching your app.
SUPABASE_HOST is <project-ref>.supabase.co by default. If your project sits behind a custom domain, use that instead. The scrape works the same way.
Logs: otlp/supabase_drain
The OTLP log drain sends logs as http/protobuf to a /v1/logs path, which is exactly what the collector's otlp receiver serves over HTTP. No gRPC needed:
receivers:
  otlp/supabase_drain:
    protocols:
      http:
        endpoint: 0.0.0.0:4318
        auth:
authenticator: bearertokenauth/supabase_drainThe auth block is the one people leave out. This receiver is on the public internet, because Supabase has to reach it. Without auth, anyone who finds the URL can write logs into your backend. The drain lets you add custom headers, so give it a bearer token and have the collector check it:
extensions:
  bearertokenauth/supabase_drain:
    token: ${env:SUPABASE_DRAIN_TOKEN}
  health_check:
endpoint: 0.0.0.0:13133Requests without Authorization: Bearer <token> are rejected before they reach a pipeline. Gzip is handled for you: turn it on in the drain settings and the receiver decompresses it.
Processors
Three processors, same order on both pipelines:
memory_limiter → resource/supabase → batch
1. memory_limiter goes first. If your backend slows down, it pushes back on the receivers before the collector gets OOM-killed. For the log drain, that means Supabase gets a retryable error instead of the collector falling over mid-batch.
processors:
  memory_limiter:
    check_interval: 1s
    limit_percentage: 80
spike_limit_percentage: 252. resource/supabase puts the same resource attributes on every metric and every log record. The project ref is always set; the other two are only filled in when Supabase didn't send them:
processors:
  resource/supabase:
    attributes:
      - key: supabase.project.ref
        value: ${env:SUPABASE_PROJECT_REF}
        action: upsert
      - key: service.namespace
        value: supabase
        action: insert
      - key: cloud.provider
        value: supabase
action: insertThis is also why the metrics side has a supabase_project scrape label and a resource attribute. The Prometheus label lands on each data point, which is what PromQL-style dashboards group by. The resource attribute is what lets you jump from a metric to the matching logs in backends that correlate on resource.
3. batch goes last. The drain already batches (up to 250 events or 1 second per request), but re-batching on the collector cuts the number of export calls to your backend.
processors:
  batch:
    send_batch_size: 8192
timeout: 10sExporter
exporters:
  otlphttp/backend:
    endpoint: ${env:OTLP_ENDPOINT}
    headers:
      Authorization: ${env:OTLP_AUTH_HEADER}
    compression: gzip
    retry_on_failure:
      enabled: true
      max_elapsed_time: 300s
    sending_queue:
      enabled: true
      sizer: items
queue_size: 100000Generic OTLP/HTTP, so it works with most observability backends, such as ClickStack, Gigapipe, SereneDB, GreptimeDB, or a collector gateway you run yourself. Swap the endpoint and header; nothing else changes.
The queue is sized in items, not requests. If the backend goes down for a few minutes, the collector holds up to 100,000 log records and data points in memory and retries for up to five minutes before giving up.
Pipelines
Two pipelines, one per Supabase source. Neither mixes in app telemetry, so you can drop this collector next to an existing one without touching it:
service:
  extensions: [health_check, bearertokenauth/supabase_drain]
  pipelines:
    metrics/supabase:
      receivers: [prometheus/supabase]
      processors: [memory_limiter, resource/supabase, batch]
      exporters: [otlphttp/backend]
    logs/supabase:
      receivers: [otlp/supabase_drain]
      processors: [memory_limiter, resource/supabase, batch]
exporters: [otlphttp/backend]Already running a collector for your app's traces? Add the two receivers, the resource/supabase processor, and the two pipelines to it instead. If your app uses the Supabase JS SDK's client-side tracing, those spans arrive on your existing otlp receiver and land in the same backend as these logs.
Get the full Supabase flow in Telflo →
Deploying
This is a single collector with no node-local state, so it runs anywhere Telflo can install one: a VM with Docker or Linux, or a Kubernetes cluster. The only hard requirement is that Supabase can reach it over HTTPS.
Environment
The flow reads six values from the environment. Telflo asks for each one when you install the collector, so nothing secret is stored in the configuration:
| Variable | What it is |
|---|---|
SUPABASE_PROJECT_REF | The project ref from your dashboard URL |
SUPABASE_HOST | <project-ref>.supabase.co, or your custom domain |
SUPABASE_SECRET_KEY | A secret API key (sb_secret_...) created for metrics |
SUPABASE_DRAIN_TOKEN | A random string you generate, e.g. openssl rand -hex 32 |
OTLP_ENDPOINT | Your backend's OTLP/HTTP base URL |
OTLP_AUTH_HEADER | Your backend's auth header value |
Deploy with Telflo
- Open the Supabase flow in Telflo, save it as a configuration, and click Publish. Published versions are read-only; to keep iterating, click Create New Version.
- Go to Fleet, click New Fleet, and choose where the collector runs: on VMs or in Kubernetes. Enter a Name and click Create fleet.
- On the fleet's Deploy Groups tab, click Assign on the Default group and choose the Supabase configuration and version.
- Click Install on the group and enter a value for each of the six variables above. Telflo adds them to the install command. Run that command where the collector should run, following Telflo's installation instructions. The command carries your fleet's install token along with the values, so treat it as sensitive.
- On the Collectors tab, the collector reports Pending pickup, then Applying, then In sync.
Telflo runs the upstream contrib build of the collector, which is the one you need: bearertokenauth isn't in the core build. Wherever it lands, open port 4318 to Supabase in your firewall or security group.
To change the pipeline later, publish a new version and assign it to the group. To roll back, assign a previous version.
Deploy without Telflo
Save the full configuration from the sections above as supabase.yaml (the flow's YAML tab has it in one piece), then run it with the contrib image. bearertokenauth isn't in the core build.
export SUPABASE_DRAIN_TOKEN=$(openssl rand -hex 32)
echo $SUPABASE_DRAIN_TOKEN   # you'll paste this into Supabase

docker run -d --name otel-supabase \
  -p 4318:4318 -p 13133:13133 \
  -e SUPABASE_PROJECT_REF=abcdefghijklmnop \
  -e SUPABASE_HOST=abcdefghijklmnop.supabase.co \
  -e SUPABASE_SECRET_KEY=sb_secret_... \
  -e SUPABASE_DRAIN_TOKEN \
  -e OTLP_ENDPOINT=https://otlp.example.com \
  -e OTLP_AUTH_HEADER="Bearer <your-token>" \
  -v $(pwd)/supabase.yaml:/etc/otelcol-contrib/config.yaml \
otel/opentelemetry-collector-contrib:0.159.0The same applies here: port 4318 has to be reachable from Supabase. Changing the pipeline means editing the file and restarting the container on every host that runs it. With Telflo, it's one publish, and every collector in the group picks it up.
TLS
Supabase sends the drain to a URL you give it, and you want that to be https://. Two options:
- Terminate TLS in front. A load balancer, ingress, or Caddy in front of port 4318. Simplest if you already have one.
- Terminate on the collector. Add a
tlsblock to the receiver and mount the cert:
receivers:
  otlp/supabase_drain:
    protocols:
      http:
        endpoint: 0.0.0.0:4318
        tls:
          cert_file: /certs/tls.crt
          key_file: /certs/tls.key
        auth:
authenticator: bearertokenauth/supabase_drainCreate the log drain
Log drains cost money. Each drain is a paid add-on: $60 per drain per project per month, plus $0.20 per million events and $0.09 per GB of egress. Drains aren't covered by the Spend Cap, so a noisy project shows up straight on the invoice. Check Supabase's log drain pricing before you turn one on.
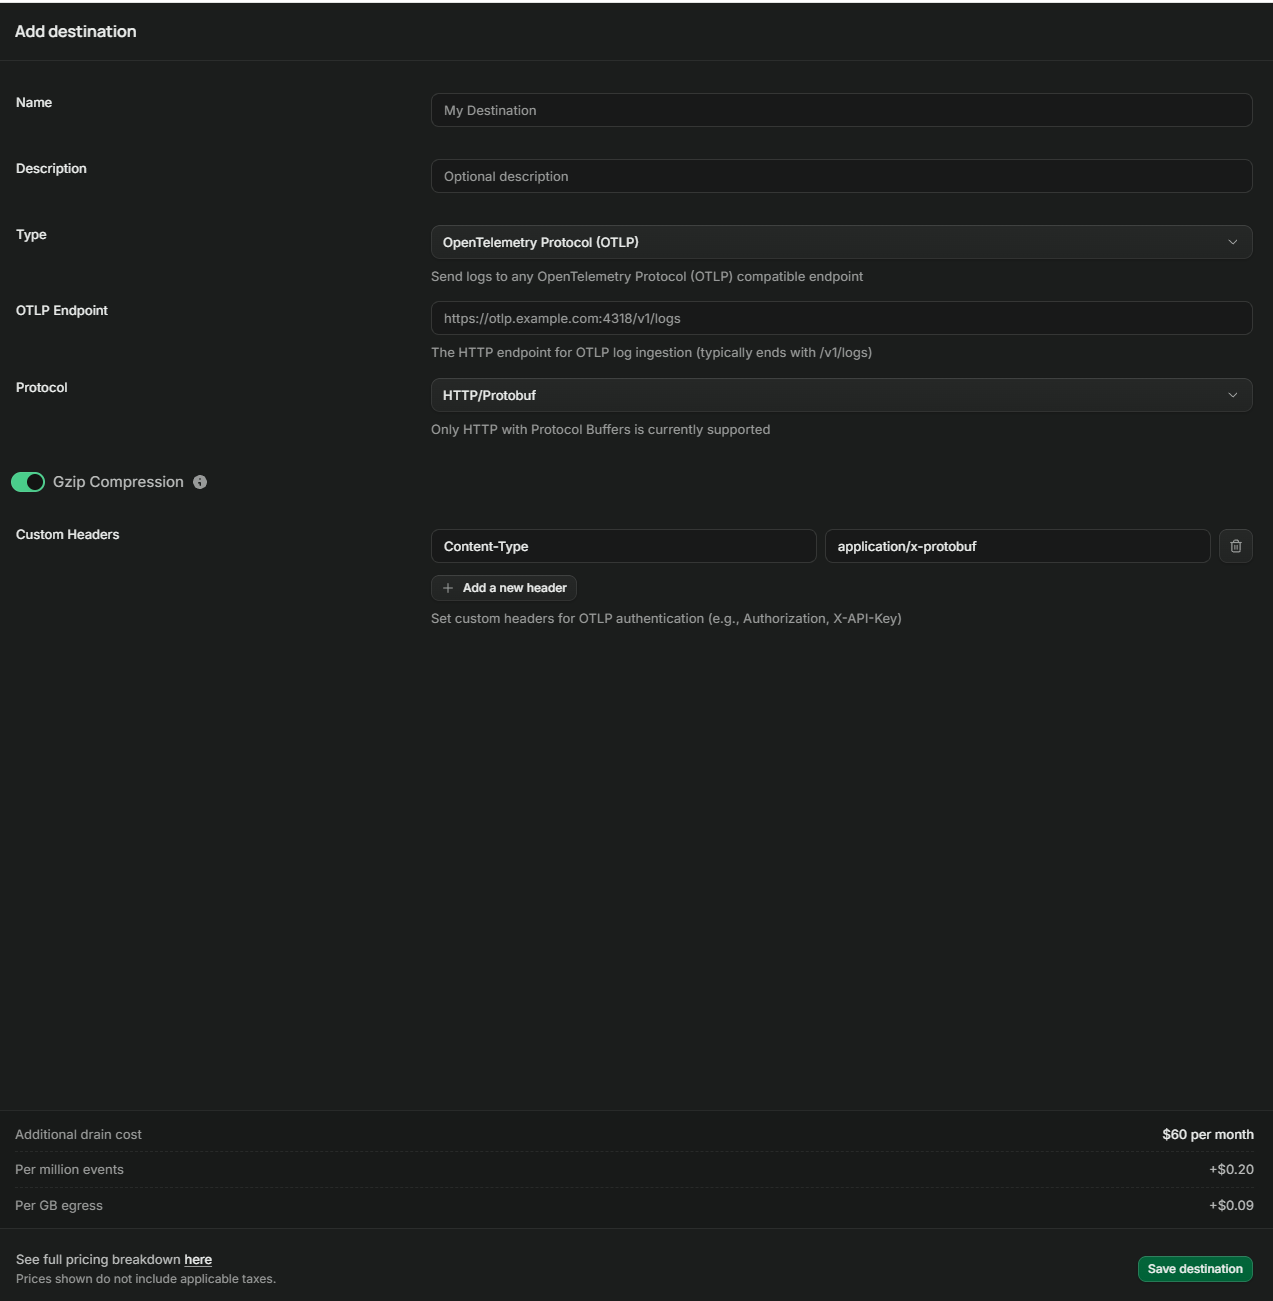
Log drains are available on the Pro, Team, and Enterprise plans. In the Supabase dashboard, go to Project Settings → Log Drains and add an OpenTelemetry (OTLP) drain:
- Endpoint:
https://otel.example.com/v1/logs - Protocol:
http/protobuf(the only option) - Gzip: on
- Header:
Authorization=Bearer <SUPABASE_DRAIN_TOKEN>
The metrics side needs no setup in Supabase. As soon as the collector starts, it begins scraping.
Verifying end-to-end
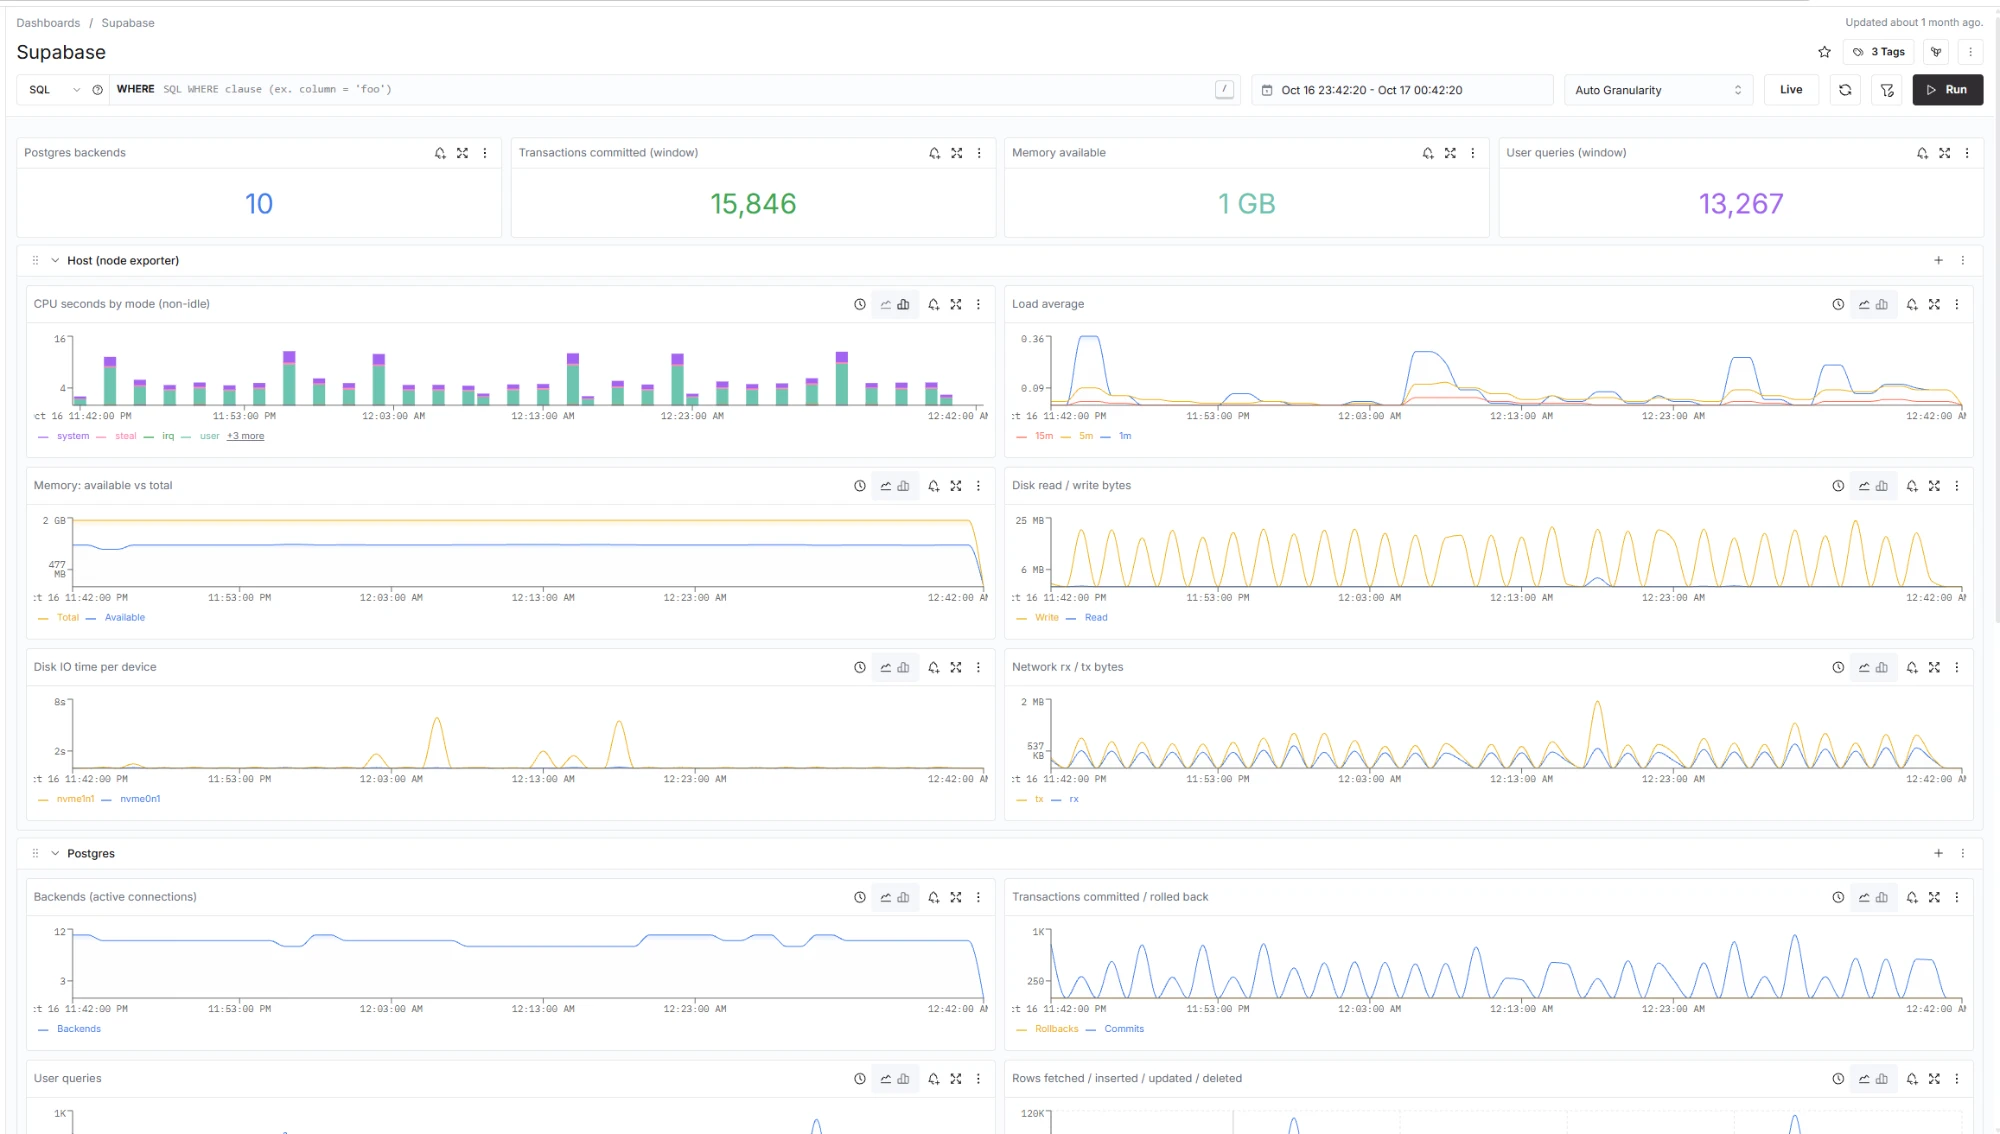
Give it a minute or two after the drain is created. You should see Supabase metrics and logs in your backend, both carrying the same supabase.project.ref. If you're on ClickStack, we built a dashboard for the metrics side, with sections for the host, Postgres, and connection pooling:
Download the ClickStack dashboard →
Import the JSON from the Dashboards page in ClickStack. Every tile is built on the plain metric names the Metrics API exposes, like pg_stat_database_num_backends and node_memory_MemAvailable_bytes, so the same queries carry over if you're on Grafana or another PromQL backend instead.
Sources
Manage your OpenTelemetry collectors with Telflo today.
Design, test, and deploy OpenTelemetry Collectors in one platform.
Sign up now