In August we wrote about why observability keeps ending up on ClickHouse. That post came with one caveat. ClickHouse added full-text search in 26.2, but it still has no relevance ranking, no BM25 and no index-backed fuzzy matching. If your team relies heavily on ranked log search, we said, stay on Elasticsearch. In practice that's usually where teams split. The ones that need ranked search stay on Elasticsearch and pay for a lot of hardware. The ones that don't end up on ClickHouse or something like it, and they mostly don't miss it.
The list of engines "like ClickHouse" keeps getting longer, because ClickHouse inspired a lot of new ones. Databend launched in 2021 and called itself "inspired by ClickHouse". chDB is "powered by ClickHouse". VictoriaMetrics says its storage "uses certain ideas from ClickHouse". SereneDB is the newest, and it starts from the search side. It describes itself as "Elasticsearch-like search and ClickHouse-like analytics in a single, Postgres-compatible database". The columns in its OTel tables follow the ClickHouse exporter's schema. Its benchmark suite uses OpenTelemetry logs and is based on ClickHouse's TextBench. According to SereneDB, it answers all 92 queries in that suite over ten billion rows.
This month, SereneDB started accepting OpenTelemetry data natively, and we built a Flow that connects a collector fleet to it. This post covers the two things we think it does well. One is search during an incident. The other, more importantly, is how your AI agents perform when using SereneDB during incidents.
What SereneDB is
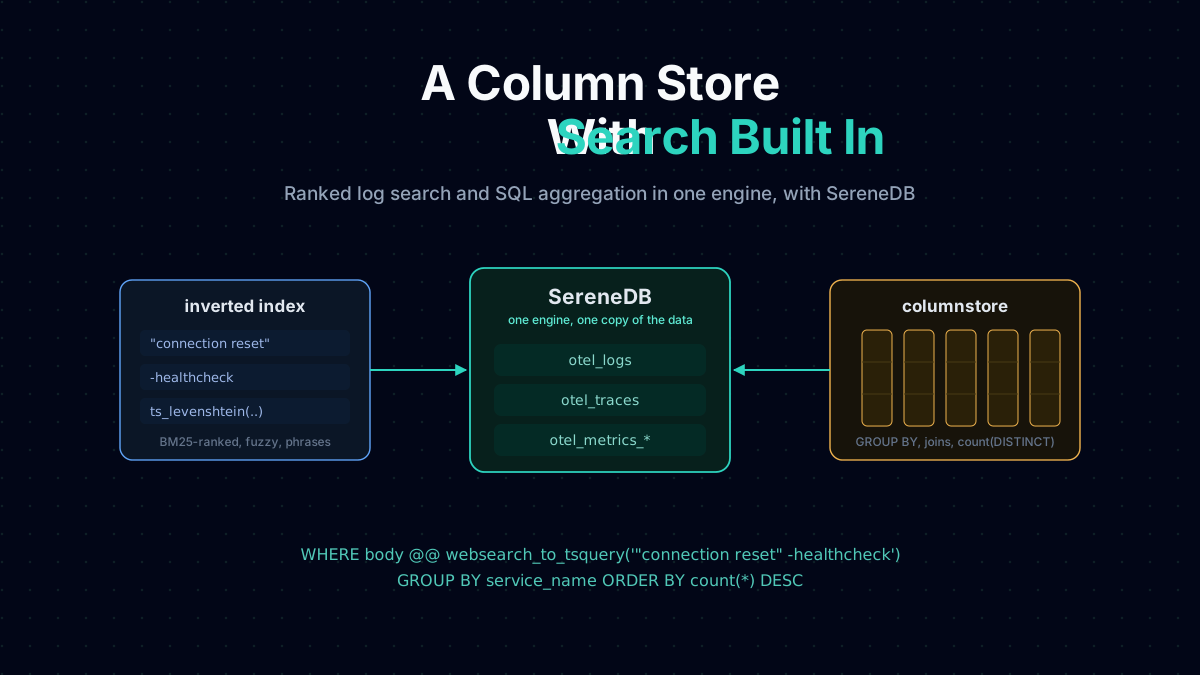
A single Apache-2.0 binary out of Berlin, started in 2025 by the team that built ArangoDB's search engine; the search core has been in production since 2018. It speaks the Postgres wire protocol, serves an Elasticsearch-compatible REST API, and accepts OTLP over HTTP directly: logs, traces and metrics arrive in seven ready-made tables (otel_logs, otel_traces, five otel_metrics_*).
The difference that matters here is direction. ClickHouse built the analytics engine first and is adding search now; SereneDB walked the same road from the other end, starting as a search engine and building the analytics in behind it. In its CTO's words, "the search index and the analytical engine are the same system."
Search during an incident
Both approaches come with a trade-off. On Elasticsearch, search during an incident works well, but the cluster is expensive, because most of the queries hitting it are aggregations. Uber measured more than 80% on its old ELK logging platform. You're paying search-engine prices for that work, and the cost is a big part of why Trip.com moved to ClickHouse. On ClickHouse, aggregations are cheap, but search only filters. It returns every row that matches, with no ranking to put the most relevant ones first.
Switching from one to the other means a migration. Running both for the same logs means keeping two copies of everything in sync. SereneDB's CTO says the engine was built to get rid of exactly that setup, a search cluster running next to a warehouse. Until now, that's why most teams have picked one system and put up with its limitations.
SereneDB runs the inverted index and the columnstore in a single engine. That lets the WHERE clause handle the ranked, fuzzy, phrase-aware search you'd normally use Elasticsearch for, and everything else in the query stays plain SQL. Log bodies get a BM25 index with a tokenizer built for telemetry. It lowercases text and splits it on word boundaries, but it keeps IP addresses, durations and dotted names like http.status_code in one piece:
SELECT ts_lexize('otel_body_dict', 'ERROR io.grpc.Client 10.0.0.7:5432 took 12ms');
-- {error,io.grpc.client,10.0.0.7,5432,took,12ms}Large companies use both approaches. At an Elastic event in 2020, Volvo Group Connected Solutions said it runs the Elastic Stack as its central logging system for more than a million connected assets. Those include the trucks and construction equipment behind brands like Volvo Trucks, Mack and Renault Trucks. Tesla went the other way for metrics. Its metrics platform, Comet, runs on ClickHouse and holds tens of billions of series.
Now say you run something smaller. You have forty thousand cars, and each one has a gateway that sends logs and metrics back through your collectors. Yesterday you pushed an over-the-air firmware update. This morning, support tells you cars keep dropping offline and then reconnecting.
Start with full-text search, the main reason a lot of teams stay on Elasticsearch. A phrase in quotes matches as a phrase. A minus sign filters out noise you already know about, like heartbeat messages. BM25() gives each result a relevance score, and you sort by it. That helps when the same logs are full of every other error the fleet has ever thrown. Here's an example:
SELECT "timestamp", service_name, body,
       BM25(otel_logs.tableoid) AS score
FROM otel_logs
WHERE body @@ websearch_to_tsquery('"gateway reconnect failed" -heartbeat')
  AND "timestamp" @@ ts_ge(TIMESTAMP_NS '2026-11-09 06:00:00')
ORDER BY score DESC LIMIT 20;Then the question becomes whether or not it's the new firmware, and how many cars. Grouping by a device attribute with forty thousand distinct values is exactly the aggregation work you're paying search-engine hardware for, and in a metrics database it would be a cardinality explosion; the engineer behind Tesla's Comet says the systems his platform competes with are "super-sensitive to high-cardinality time series". In a column store, ClickHouse very much included, it's routine, and here it wraps around the same search predicate:
SELECT resource_attributes ->> 'firmware.version' AS firmware,
       count(*) AS hits,
       count(DISTINCT resource_attributes ->> 'device.id') AS devices
FROM otel_logs
WHERE body @@ websearch_to_tsquery('"gateway reconnect failed" -heartbeat')
  AND "timestamp" @@ ts_ge(TIMESTAMP_NS '2026-11-09 06:00:00')
GROUP BY resource_attributes ->> 'firmware.version'
ORDER BY devices DESC;Say the top row is 4.1.2 with three thousand cars. To look at one of them, search its device ID. The tokenizer keeps an ID like this whole in the index, so the search is an indexed lookup, not a scan over a day of logs:
SELECT "timestamp", service_name, body
FROM otel_logs
WHERE body @@ 'veh0042137'
  AND "timestamp" @@ ts_ge(TIMESTAMP_NS '2026-11-09 06:00:00')
ORDER BY "timestamp";You halt the 4.1.2 rollout and can determine the root issue without the pressure. None of this is vehicle-specific, either; payment terminals, smart meters or plain Kubernetes pods work the same way.
The payoff depends on where you're coming from. If you're on Elasticsearch, this is the kind of cost profile people migrate to ClickHouse for without losing the search that kept you there. If you're on ClickHouse, it's the ranked search we told people to stay on Elasticsearch for, and plenty of teams get by fine without that. The stronger reason to look is the next section, where the queries stop coming from people. And if you rarely search logs by relevance, you should probably stay where you are; our ClickHouse post remains valid.
When an agent is writing the queries
The second use case is newer. In August, ClickHouse wrote that more than 60% of queries to LogHouse, its internal logging platform, now come from an agent. Honeycomb says it handles about two million agent-run queries a month, and that queries from people haven't dropped. Telemetry stores now have a new kind of user. It's an agent that reads the schema, writes its own queries, and has to guess what the logs actually say.
Why does this matter? Because the agent can do some of the work for you. Today that mostly means the first look at an alert. The alert fires, and before the on-call engineer is notified, the agent has run a dozen queries and posted a summary. The engineer starts from that summary instead of from nothing. Most AI SRE tools are built around the same idea. How much you can trust the summary depends on the database behind it, because nobody is checking the queries the agent ran.
Agents get this wrong in a different way than people do. An engineer who searches for conection timeout and gets no results will spot the typo. An agent that gets no results either decides there were no timeouts, or tries three more searches with different wording. Most agent setups limit those retries, and the agent can still end up with the same wrong summary. Exact matching makes it worse, because the text in production logs is rarely what anyone remembers. The service is actually called checkout-v2, or the error says connection reset by peer.
On SereneDB the misspelled guess can still find the real string, because fuzzy matching is an ordinary query function:
SELECT "timestamp", service_name, body
FROM otel_logs
WHERE body @@ ts_levenshtein('conection')
  AND "timestamp" @@ ts_ge(TIMESTAMP_NS '2026-11-09 14:00:00')
ORDER BY "timestamp" DESC LIMIT 50;ts_levenshtein matches tokens within an edit distance it picks from the query's length, and a swap of two adjacent characters counts as one edit. Wildcards (ts_like), prefixes (ts_starts_with) and regular expressions over indexed terms (ts_regexp) cover the cases where the agent knows roughly what the string looks like. Every retry an agent skips is a whole model turn saved, the turn it would have spent reading the empty result and writing a new query, so first-try hits make an investigation cheaper and faster. Not retrying is even worse: an agent that believes the query is not returning any results writes a summary that is confidently wrong, and matching through the typo removes one of the most common ways that happens.
Before drilling anywhere, an agent can also ask the index what values exist. Facets are read from the term dictionary rather than from the rows:
SELECT unnest(ts_dict_agg(service_name)) AS service,
       unnest(ts_dict_count(service_name)) AS n
FROM otel_logs
WHERE body @@ 'timeout';That tells the agent which services are even involved before it starts drilling, and it makes sure the next query is using values that actually exist. A model will produce a plausible service name that doesn't exist if left to guess; the facet list comes straight from the index, so every name on it is real.
SereneDB also has an MCP server with six tools. Five of them let an agent read SereneDB's documentation. The sixth checks a query without running it. If a statement would scan the whole table, the agent finds out before it wastes a real query on it. You can register the server with Claude Code in one command, using a role you've set up for the agent:
claude mcp add --transport http serenedb http://serenedb.internal:8080/_mcp \
--header "Authorization: Basic $(printf 'agent_ro:<password>' | base64)"Cross-signal questions are a join. A latency spike in otel_traces and the error logs behind it share an indexed trace_id, and any SQL store can join the two; the new part is that the log side of the join can be the same ranked, typo-tolerant search.
None of this needs a custom integration. It's SQL over the Postgres wire, which a coding agent can drive with plain psql. When Datadog built an agent-facing query layer over its own store, it also went with Postgres-compatible SQL. SereneDB's CEO is betting the load gets much bigger: "Today an AI agent is a single bee visiting a single flower. What is coming is the swarm: more agents than employees in every organization, each firing hundreds of queries a second." Maybe. Even at today's load, fewer retried guesses means fewer model turns to pay for, and fewer misses means fewer confidently wrong summaries by these agents.
Wiring a fleet into it
Every OTLP request carries a fixed cost. The server performs best with a handful of large requests, but SDKs tend to send lots of small ones. That's why SereneDB recommends you "put an OpenTelemetry Collector in front of SereneDB as a batching proxy". The collector also smooths over a protocol mismatch: SereneDB only accepts OTLP over HTTP, and plenty of SDK setups use gRPC.
We built that collector as a Flow in Telflo, which means you don't have to write the config yourself. It accepts OTLP over both gRPC and HTTP and batches at SereneDB's documented sizes. Authentication goes through a database role. It also dual-writes, so your current backend keeps getting everything while SereneDB receives a copy. A trial won't touch your apps or disrupt your workflows. You set endpoints and credentials as environment variables at install time, and logs, traces and metrics all run through the same pipeline.
One thing to watch during the trial is that your existing backend will start receiving the large batches too. If it caps request sizes, split the two exporters into separate pipelines in the Flow before you publish.
Get the SereneDB Flow in Telflo →
Open the Flow and save it as a configuration. Once you publish it and assign it to a deploy group, every collector in that group pulls the new version on its next poll. If you don't have any collectors yet, use the install command on the deploy group. It sets them up with the environment values already filled in.
Later changes are where the difference shows. Without Telflo, adjusting batch sizes or removing the dual-write once you're finished means another rollout through whatever config management reaches those boxes. With Telflo, it's a single published change, and you can test it against sample data before it goes out.
If none of this sounds like a problem you have, keep what you run. If it does, SereneDB is worth a look.
Sources
- SereneDB: OpenTelemetry import
- SereneDB: full-text search functions
- SereneDB: documentation for AI agents over MCP
- SereneDB: observability use case
- SereneDB releases
- ClickHouse: how Tesla built a quadrillion-scale observability platform
- Elastic: Volvo Group Connected Solutions, starting the observability journey
- ClickHouse: is ClickHouse winning the observability wars?
- Honeycomb: what comes after observability?
- otlphttp exporter, basicauth extension
Manage your OpenTelemetry collectors with Telflo today.
Design, test, and deploy OpenTelemetry Collectors in one platform.
Sign up now