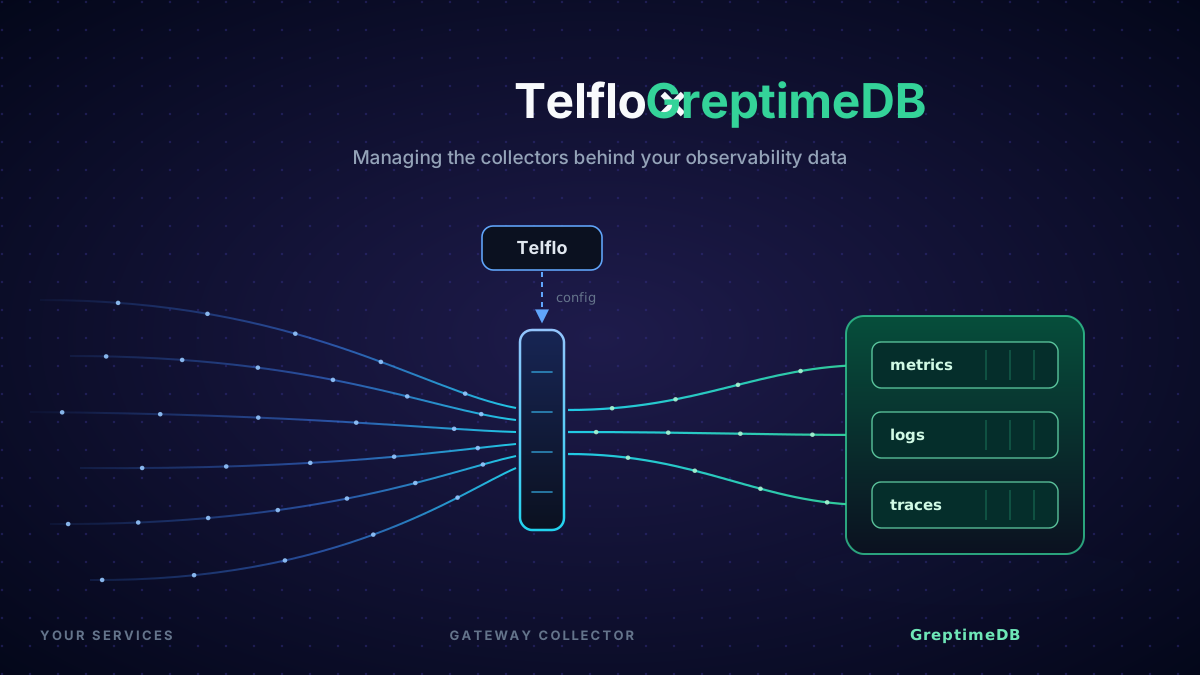

A lot of teams already monitor their apps and infrastructure with OpenTelemetry and send it all to GreptimeDB. It makes sense. You get one database for metrics, logs, and traces, it sits on object storage, and you can query all of it with SQL, plus PromQL for metrics. Your engineers can, and your AI agents can too.
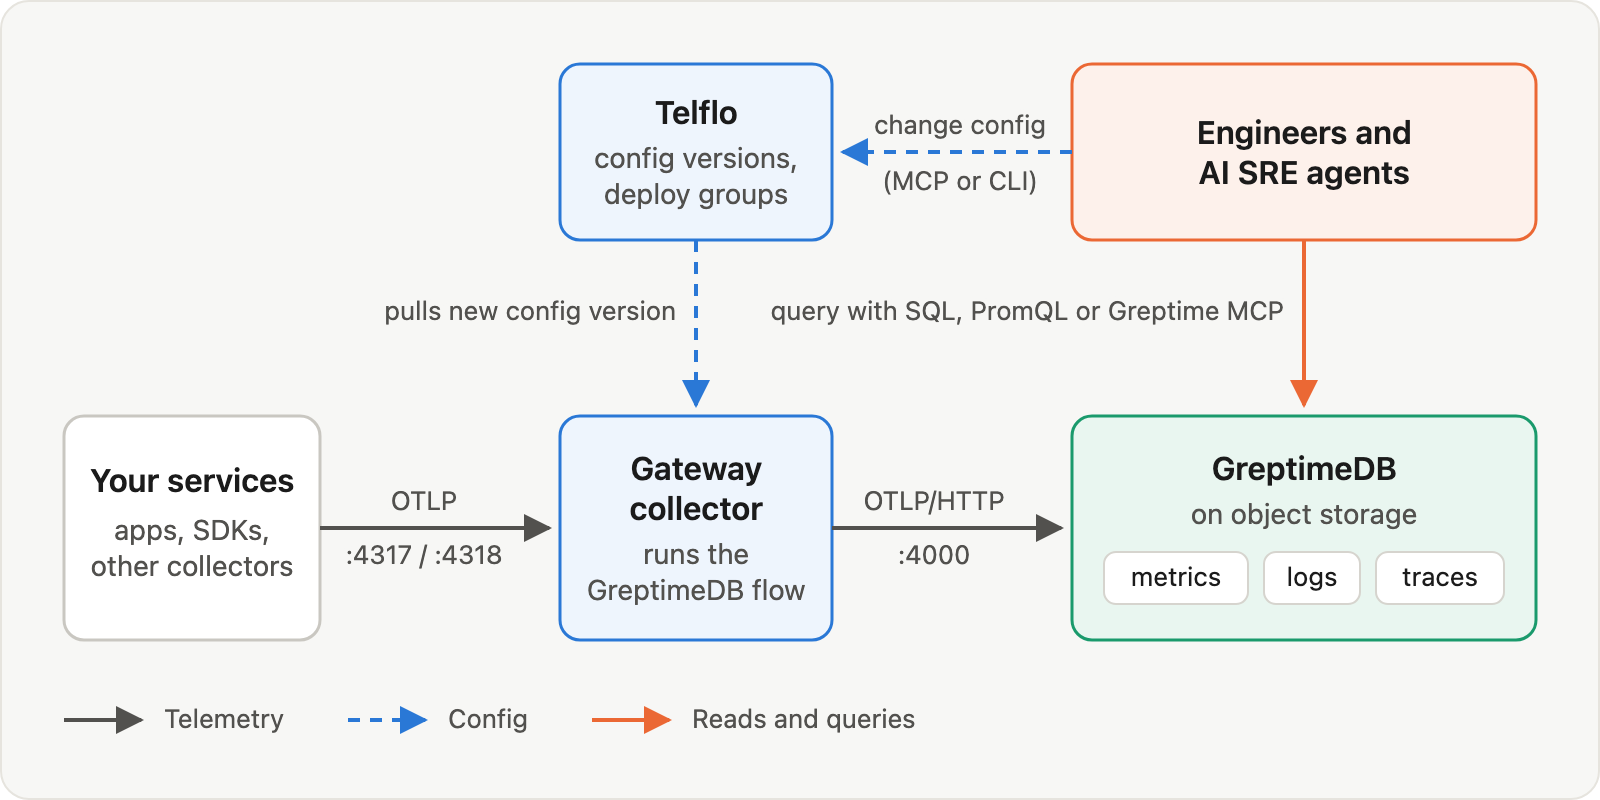
The database side of that setup is in good shape. The collector side is usually where the trouble starts. GreptimeDB stores and serves the data, and Telflo manages the OpenTelemetry Collectors that decide what gets there in the first place.
That's why we partnered with Greptime to create a ready-made flow for shipping OTel data to GreptimeDB. This post covers why the two fit together and what the flow does.
Why this partnership matters
Once teams have GreptimeDB in place, the next question is usually about the collectors. How do you get the right data into it and keep it that way? Three things usually come up.
Changing a config is slow. Want to add an attribute or drop a noisy log source? That means editing YAML, redeploying, and restarting collectors one environment at a time. A five-minute change can take days to reach the whole fleet.
Configs are code, but nobody tests them. Your collector config decides what lands in every GreptimeDB table, and most of the time it ships with zero tests. You find the mistakes later, when you spot a missing column, a table that's way bigger than it should be, or sensitive data sitting in storage.
It's never done. Services change, teams add instrumentation, and what you need from your data keeps shifting. Managing collectors is an ongoing process.
Telflo handles all three. You publish a change once, and every collector in the deploy group you assign it to picks it up on its next check-in. Before a change ships, you can test it against sample data on a real collector. And every version is kept. To roll back, you deploy an earlier one.
Why GreptimeDB
A few things about how GreptimeDB is built shaped the way we put the flow together.
Object storage is the primary storage. Your data lives in S3, GCS, or Azure Blob, and local disk is mostly a cache. Compute scales separately from storage, and you can add or remove nodes without copying all the data between them. Greptime reports up to 50x lower storage cost from compression and object storage. Once keeping data is that cheap, the question that's left is what's worth collecting. That gets decided in the collector.
One engine, but each signal gets its own shape. Metrics go to the Metric Engine, where lots of logical tables share one physical table. Traces go to an append-only table partitioned by trace_id. Headers sent with the data can override those defaults, which is why the flow uses a separate exporter for each signal.
Queries fan out in parallel. The Frontend figures out which partitions it can skip, then sends each Datanode its piece of the query, which can include filters and aggregations. Each Datanode runs its piece right next to the data and streams the results back. Datanodes can also skip data using the primary key and indexes, which works best when there's something consistent to filter on. The flow makes sure every signal carries service.name, and an environment too when you set DEPLOYMENT_ENVIRONMENT.
It's built for agents. Greptime ships an MCP server, Agent Skills that walk agents through operations, and a table semantic layer that tells an agent what each table holds. That covers the database side. The next question is whether the data agents are reading is any good. To change what the collectors send, the same agent can use Telflo's MCP server or CLI.
Your collector config shapes your tables
GreptimeDB takes OpenTelemetry over OTLP/HTTP and creates tables on the first write. There's no schema to set up ahead of time. But how each table gets created comes from headers your collector sends along with the data:
X-Greptime-Log-Extract-Keyspicks which attributes become their own columns. On an auto-created table, those columns become part of the primary key.x-greptime-pipeline-name: greptime_trace_v1picks the trace data model for the table GreptimeDB's Jaeger-compatible API reads from.x-greptime-hints: ttl=30dsets retention when the table gets created.
Most of these are easy to change later. You can add indexes or change TTL with ALTER TABLE, and you can add new tag columns. One mistake is expensive though. Put something like service.instance.id in the primary key and you get a new series every time an instance restarts. And you can't turn an existing tag back into a regular column.
These headers belong in one versioned config that every collector picks up.
The flow: Ship OTel data to GreptimeDB
The flow runs as a standalone gateway. Point your apps, SDKs, and other collectors at it on :4317 (gRPC) or :4318 (HTTP). It does three things.
- Fills in what's missing. A missing
service.namebecomesunknown_service, and logs without a timestamp get their observed time. If you setDEPLOYMENT_ENVIRONMENT,deployment.environment.namegets stamped on anything that arrives without one. The gateway doesn't add host attributes of its own, which keeps its hostname off someone else's data. - Keeps the primary key small. Logs only promote
service.name,service.namespace, anddeployment.environment.name. Per-instance IDs stay out of the key. If you need them later, they're still in theresource_attributesJSON column. - Sets retention up front. Logs and traces both carry a 30-day TTL hint, which GreptimeDB applies when it creates each table. If either table already exists, the hint won't change it. Set its TTL with
ALTER TABLE.
Metrics barely need anything. GreptimeDB already keeps 19 common resource attributes as labels, and the flow asks it to keep host.name too. Exports queue on disk. As long as that queue sits on a persistent volume, you don't lose queued data if the gateway restarts or GreptimeDB goes down for a bit. Every exporter also gets a 30-second timeout, which gives large batches room over long-distance links.
Get the full GreptimeDB flow in Telflo →
Agents keep the loop running
More and more of that ongoing work is getting done by AI agents. An agent reading GreptimeDB sees what's actually stored, which makes it the right one to notice what needs to change upstream, in the collectors.
Mask what shouldn't be there. The agent finds emails or tokens sitting in a logs table. It adds a redaction rule to the collector, and they never land again.
Enrich what's missing. Logs with no service or environment won't show up when you filter by either one. The agent adds that context in the collector, on every record, all the time.
Turn off what nobody uses. Attributes and log sources you never query still cost you ingest and storage. The agent drops them at the source.
Every one of those changes goes through Telflo the same way yours would. It's a versioned config that can be tested on a real collector, rolled out to the fleet, and rolled back if something's off. GreptimeDB shows the agent what to change. Telflo makes the change.
That's how the data in GreptimeDB stays complete and safe every day.
During an incident, an AI SRE agent can also use Telflo to turn collection up on the services it's looking into, look again, and turn it back down when it's done. In our benchmark, Claude Code, HolmesGPT, and a custom loop agent we wrote found the root cause in 34% of trials on the same baseline collector config, and in 83% when they could also turn collection up through Telflo. That's 145% more root causes across nine incidents.
The benchmark ran on the OpenTelemetry Demo and didn't use GreptimeDB. Turning collection up didn't help when an incident had already ended before the agent started looking, because by then there was nothing left to collect.
Get started
- Open the Ship OTel data to GreptimeDB flow in Telflo. A free account is all you need.
- Test it against sample data, then publish it and assign it to a deploy group.
- Install a collector in that deploy group. Telflo's install dialog lists
GREPTIMEDB_ENDPOINT(the HTTP base URL, port 4000 by default, no trailing slash),GREPTIMEDB_DATABASE,GREPTIMEDB_USERNAME, andGREPTIMEDB_PASSWORD. Fill them in there or set them on the host, which is where the password should go. AddDEPLOYMENT_ENVIRONMENTif you want the flow to stamp an environment on data that arrives without one.
On the GreptimeDB side, check out Greptime's OpenTelemetry guide and the GreptimeDB MCP server. To hand your collector fleet to an agent, see Telflo for agents.
Telflo is a vendor-neutral control plane that engineers and AI agents use to manage OpenTelemetry Collectors.
Manage your OpenTelemetry collectors with Telflo today.
Design, test, and deploy OpenTelemetry Collectors in one platform.
Sign up now