
You're running Grafana on Loki, Mimir and Tempo. They do scale, and plenty of teams run them well. One operator on Hacker News says their Loki takes in about 1 TB an hour on the stock microservices config with very little maintenance. But at real volume each of the three is a separate distributed system, and between them you're looking at about two dozen component types in microservices mode, plus object storage, cache pools, hash rings and, in the newer architectures, Kafka too. So yeah it's free, but past a certain size you're paying a team to keep it running.
And you keep hearing about ClickHouse and how cheap and scalable it is for telemetry. We went through the reasons in an earlier post, and a lot of it is about compression. ClickHouse's internal logging platform stores 431 PiB of raw telemetry as 27 PiB on disk, about 16x on their setup.
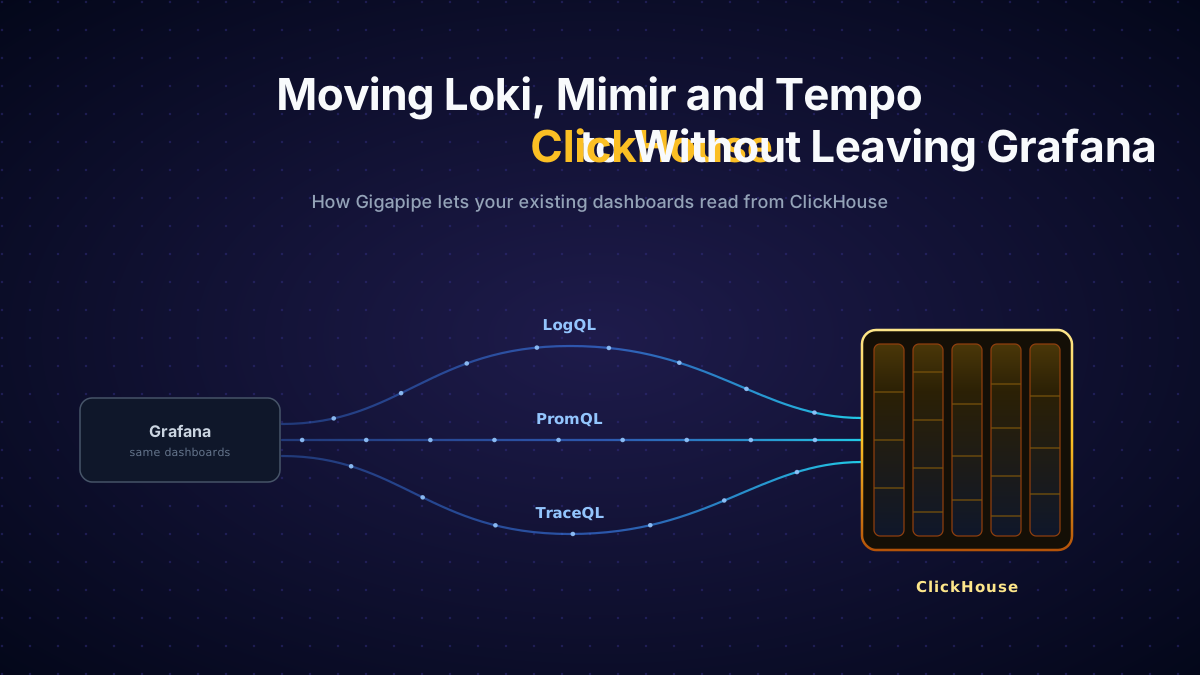
So you want to move to ClickHouse. But all of your dashboards and alerts and SLOs are written in LogQL, PromQL and TraceQL, and ClickHouse speaks SQL. You don't want to rewrite all of that, and you want to keep using the Grafana UI. Gigapipe is an open-source server that stores everything in ClickHouse and answers the Loki, Prometheus and Tempo APIs, so Grafana keeps working after you change three datasource URLs.
What Gigapipe is
Gigapipe is a single Go binary that serves those three APIs, plus Pyroscope's, on one port. Grafana's built-in datasources point directly to it, so there's no plugin to install. On the write side it takes Loki push, Prometheus remote_write and OTLP.
You do still have to run ClickHouse, and at scale that's a cluster too, with shards, replicas and Keeper. But it's one database for logs, metrics and traces. And if you'd rather not run ClickHouse at all, there's also a managed version.
Keeping the query language and swapping the storage underneath has been done before. Tesla built a PromQL layer over ClickHouse for their metrics platform so that the dashboards, alerts and other tools they already had would keep working without any rewrites. Gigapipe does the same kind of thing, but for all three query languages.
What carries over and what needs work
Of the three query languages, PromQL is the easy one. Gigapipe runs it on the same query engine Prometheus uses and acts as the storage underneath, so metric dashboards should behave the way they do today. LogQL gets translated into ClickHouse SQL. The everyday log queries work, but some of the more advanced ones don't parse. So test your busiest log queries before you switch.
Traces are mostly fine. Trace lookup and TraceQL search work, and so do the common TraceQL metrics like rate(), count_over_time() and quantile_over_time() on span duration. But a few structural operators like >> don't parse, and service graphs need their metrics from somewhere else, like the collector's servicegraph connector.
Outside of the queries, what carries over mostly depends on whether it lives in Grafana or inside Loki, Mimir and Tempo.
- Dashboards. Repoint the datasources you already have and keep the same name, uid and type. Panels find their datasource by uid, so the dashboard JSON needs no edits. If your Mimir datasource URL ends in
/prometheus, drop that suffix. - Alerts. Grafana-managed alert rules keep working, since Grafana runs them against the datasource like any panel. Alerts stored in the Loki or Mimir ruler won't fire anymore, because Gigapipe's ruler only runs recording rules. Import them into Grafana-managed rules while the old ruler is still up (recent Grafana versions have an import for this). The import can leave them paused, so nothing pages twice before you switch the old ones off.
- Recording rules and SLOs. You load recording rules into Gigapipe's ruler once you turn it on (it's off by default), and the burn-rate alerts from those tools become Grafana-managed. Give every rule group an explicit
interval:, because Gigapipe skips groups without one. - History. There's no import tool, and your old data stays in Loki, Mimir and Tempo.
- Tenants. Open-source Gigapipe has no per-tenant isolation and ignores the
X-Scope-OrgIDheader, so a multi-tenant setup runs one Gigapipe per tenant, each on a separate ClickHouse database.
How the switch goes
Since history doesn't move, the switch is really a dual-write. You stand Gigapipe up next to your current stack (the Gigapipe docs cover the install), send it a copy of everything, and cut over once it holds enough history for your longest lookback, whether that's a 30-day SLO window, your log retention etc. Gigapipe keeps 7 days by default, so raise SAMPLES_DAYS to cover that window before you start.
The copy can come from the agents you already run. Promtail, Alloy and Prometheus can each add Gigapipe as a second Loki push or remote_write target, and anything sending traces to Tempo over OTLP can add it as a second OTLP target. One thing to check is the remote_write URL. Gigapipe doesn't serve Mimir's /api/v1/push path, so point it at /api/v1/prom/remote/write (or the older /api/prom/push). If you already run collectors, fan out from there instead and add Gigapipe as a second exporter, which is the pattern our dual-backend migration Flow shows (Flows are the ready-made collector configs in our library).
Load your recording rules into Gigapipe's ruler on day 0, so the SLO windows have filled up by the time you switch. And while you wait, point a few temporary datasources with new uids at Gigapipe and run your busiest queries against both in Explore's split view.
On day N you flip the URLs. If you provision your datasources, Grafana matches them by name and updates them in place, and panels and alerts follow the uid, so leave the name and uid as they are and only change the URL.
Keep writing to both for a few days in case you need to flip back, then stop writing to the old stack. If people still need older data, keep Loki, Mimir and Tempo around read-only under new datasource names and turn them off when that window runs out.
Getting data in
If you already run the OpenTelemetry collector, the pipeline to Gigapipe is pretty short, and we built a Flow for it. Ship OTel data to Gigapipe takes logs, metrics and traces in on an OTLP receiver, runs them through memory_limiter and batch, and sends them to Gigapipe with basic auth and a disk-backed queue. Gigapipe works with the stock collector, so the Flow uses the standard OTLP/HTTP exporter pointed at port 3100. We went through an early version with the Gigapipe team and ran it in our demo environment, shipping the OpenTelemetry demo app into a self-hosted Gigapipe. All you fill in is GIGAPIPE_ENDPOINT, GIGAPIPE_USERNAME and GIGAPIPE_PASSWORD, and you need Gigapipe 5.3.0 or later for OTLP metrics. Self-hosted Gigapipe doesn't do TLS, so if your collectors aren't on the same network, put a TLS proxy in front of it.
If your agents today are Promtail, Alloy or Prometheus and you want to move to the collector, do that after the cut-over as a separate change. Promtail hit end of life in March 2026, so you may be replacing it anyway, but switching agents changes your label names, and you don't want to debug a new backend and new labels in the same week.
Metrics have to arrive cumulative, which is the OTel SDK default and what the Gigapipe docs ask for. Gigapipe rejects delta metrics with a "partial success" warning in the collector log, so if one of your sources sends delta, add a delta-to-cumulative processor to the Flow.
And keep an eye on labels. Every OTLP log attribute becomes a Gigapipe label, and the Gigapipe team's advice is to keep labels low cardinality, things like level and service name, so queries stay fast. That still matters on ClickHouse, because Gigapipe keeps the Loki and Prometheus data model: every unique set of labels is a separate stream with its own rows in an index table that every query goes through. So the collector ends up being where you decide which attributes ship. Once you have a lot of collectors, it's easy for their configs to drift apart when one gets an update and the others don't.
We build Telflo, an OpenTelemetry-native control plane that provides centralized configuration management for collector fleets. You can open the Flow in Telflo, drop the attributes you don't want as labels, test the change against sample data and push the same config to every collector remotely.
Who this is for
This move makes the most sense for teams on Grafana with Loki, Mimir and Tempo who are tired of running the storage and have years of LogQL, PromQL and TraceQL sitting in dashboards and alerts. Gigapipe lets you keep most of that while new data lands in ClickHouse. If your Loki, Mimir and Tempo setup runs fine and nobody minds running it, keep it. And if you're starting from scratch, Grafana with the ClickHouse datasource plugin and plain SQL queries is the simpler setup.
If you're in the middle of a move like this, we'd like to hear how it's going. Tell us about it.
Manage your OpenTelemetry collectors with Telflo today.
Design, test, and deploy OpenTelemetry Collectors in one platform.
Sign up now